Arctic Oscillation Index [AO index]
Teleconnective indices: Arctic Oscillation Index [AO index]
The Arctic Oscillation Index (AO) is a large-scale index of climate variability. It is an important mode
of climate variability for the Northern Hemisphere. It coincides with the North Annular Mode (NAM), when
the latter is calculated at 1000 hPa (the NAM is calculated up to stratospheric altitudes).
For more, please refer to the dedicated page to NAM.
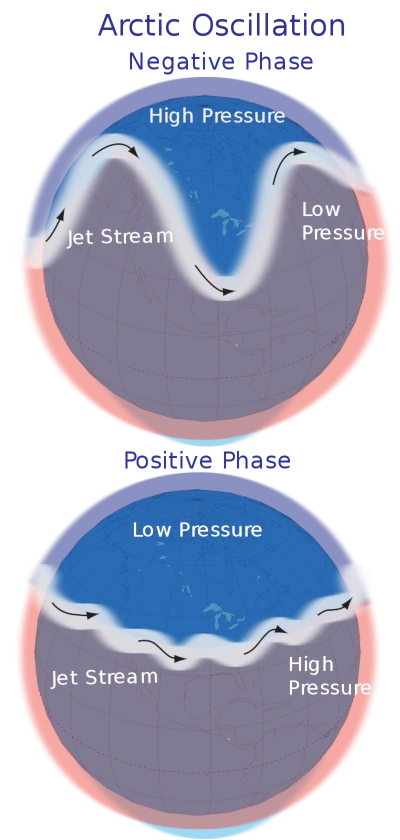
When the AO is in its positive phase (AO+), a ring of strong winds circulating
counterclockwise around the North Pole confines colder air to the polar regions. In this phase,
the pressure at sea level at high latitudes is extremely low (strengthening of the polar vortex, that
is the area of low pressure that is stationed semi-permanently high above the North Pole),
while at mid-latitudes there is a strengthening of anticyclones. With a deep polar vortex,
particularly strong western currents are observed, not very wavy and therefore with consequent reduced
heat exchange with the lower latitudes.
When the wind belt becomes weaker and more distorted we are in the negative phase of the AO (AO-);
in this phase, characterized by low pressures in the mid-latitudes, an easier penetration towards
the south of the cold arctic air masses is observed and an increase in storminess in the mid-latitudes.
The intensity of the phenomenon can also lead to the splitting of the polar vortex, with powerful
irruptions of cold air in the mid-latitudes.
The AO is calculated by projecting the daily geopotential anomalies at 1000 hPa between latitudes
between 20° N and 90° N with respect to the Arctic oscillation model defined by an empirical function
of the monthly geopotential averages at 1000 hPa during the period 1979- 2000 (see the map in the figure).
The time series is then normalized with the standard deviation of the monthly average.
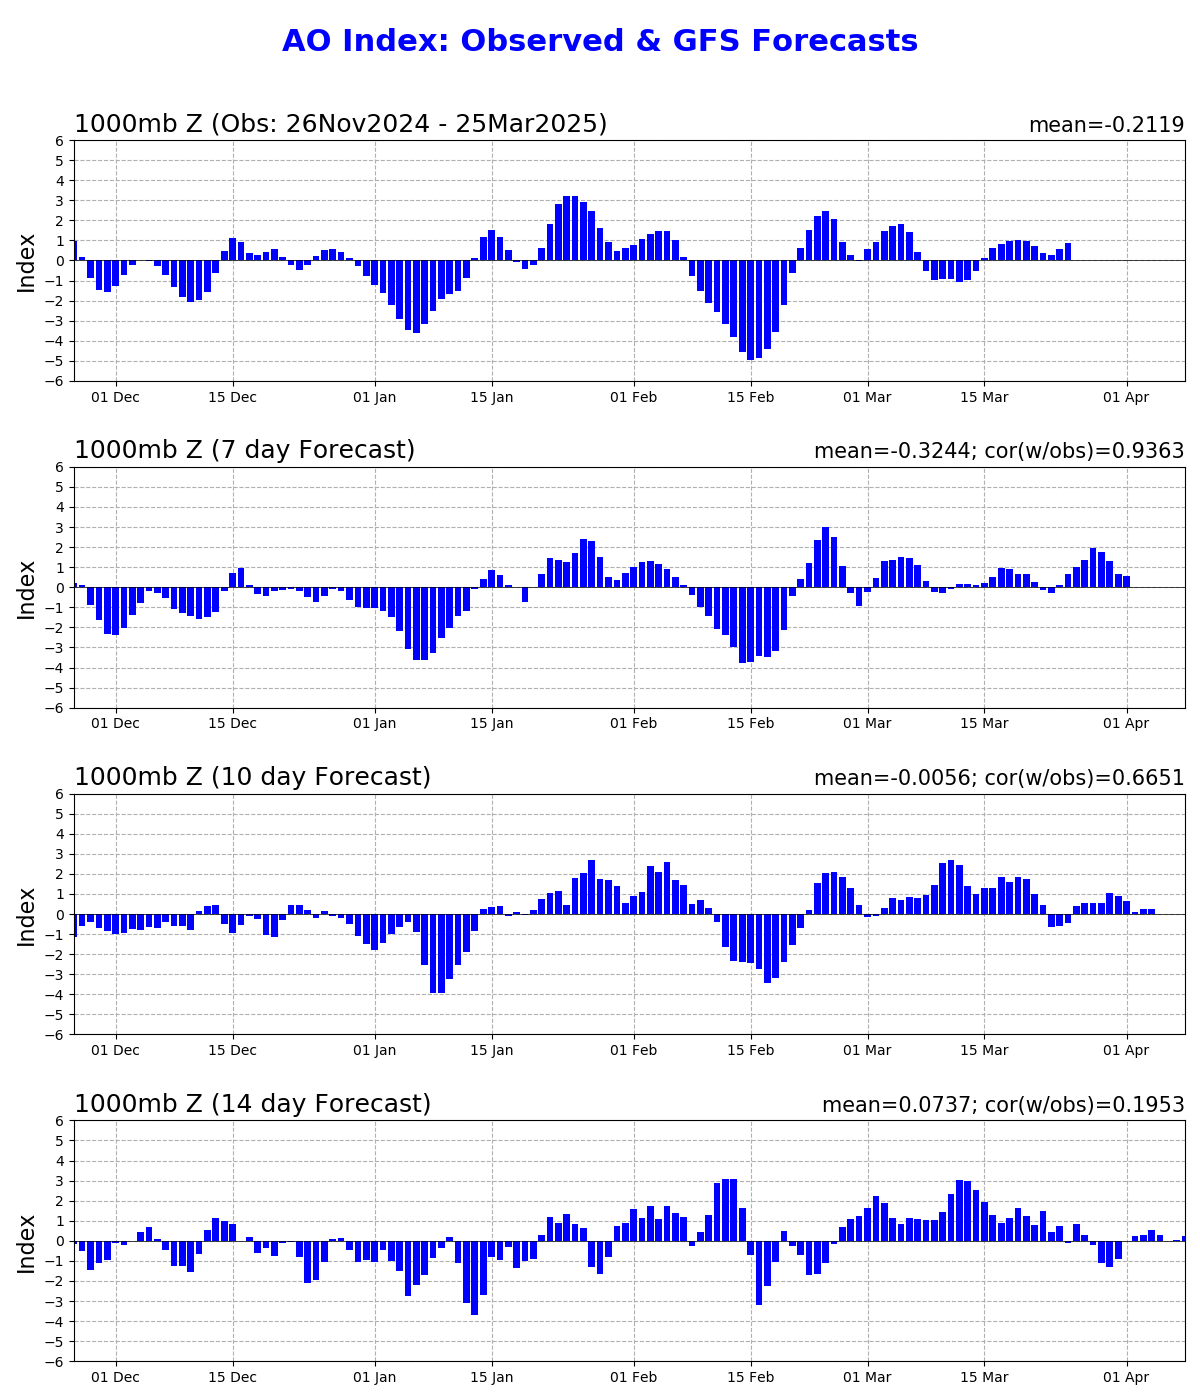
Arctic oscillation - AO index: observed & GFS Forecasts
The daily AO indices are shown for the previous 120 days. The indices are standardized by standard
deviation of the observed monthly AO index from 1979-2000.
The values at the upper left and right corner of each figure indicate the mean value of
the AO index and the correlation coefficients between the observation and the forecasts, respectively.
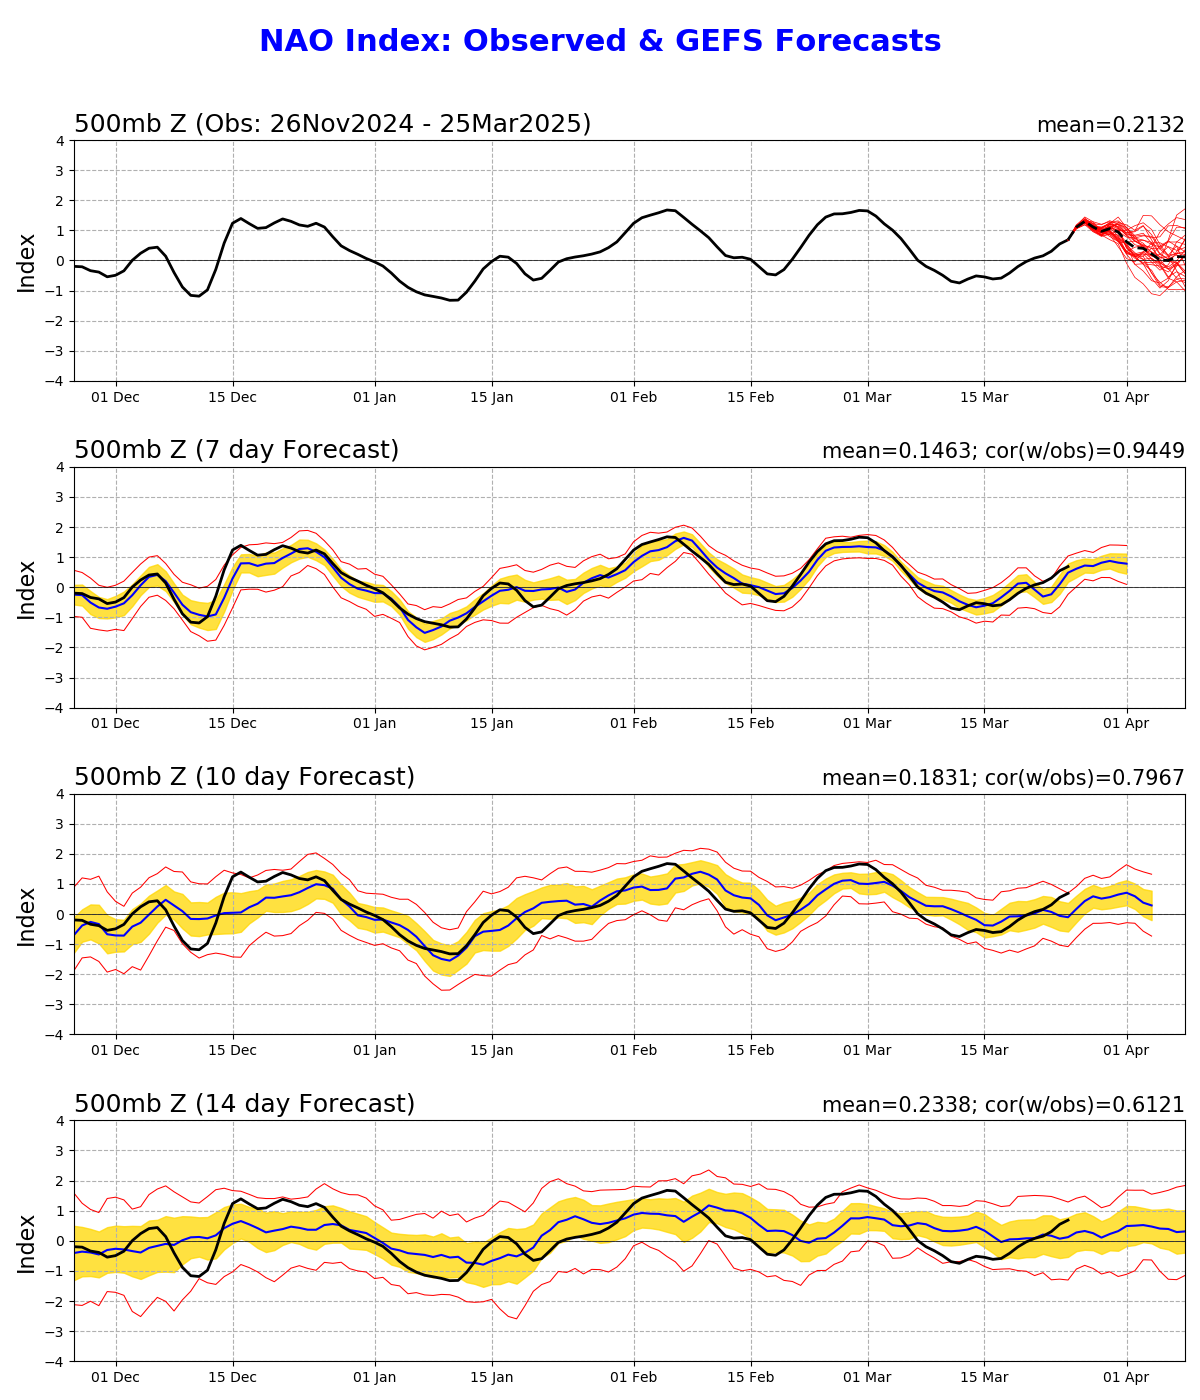
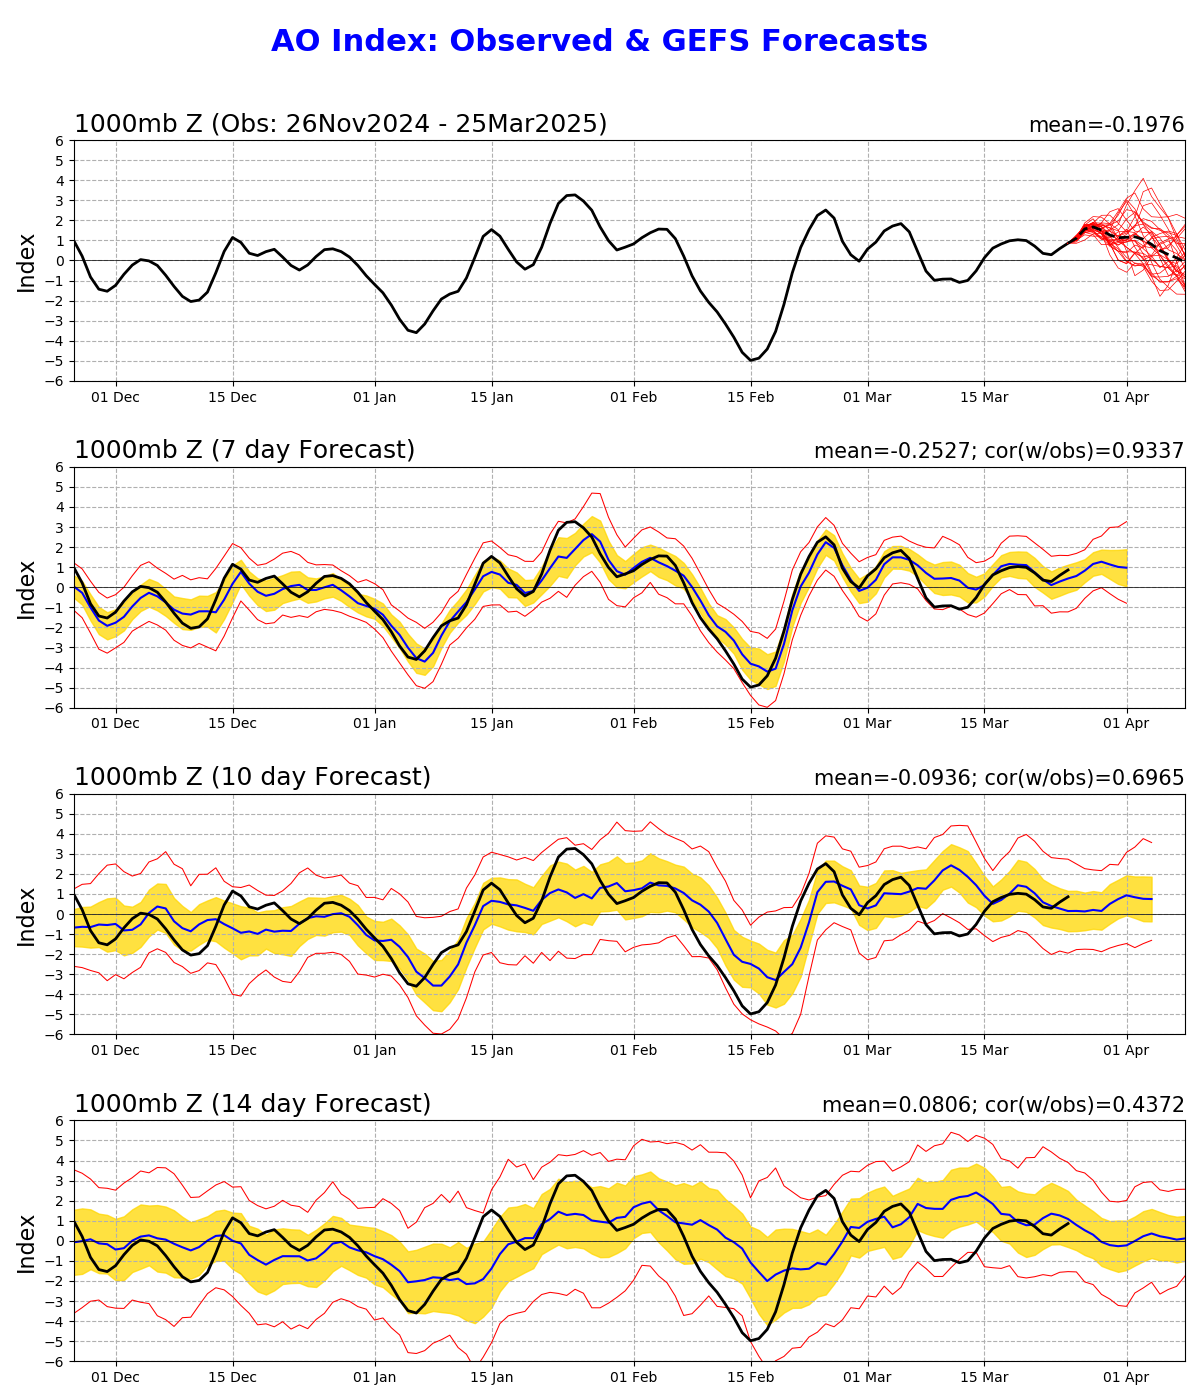
AO index: observed and Ensemble forecast
The daily AO indices are shown for the previous 120 days, and the ensemble forecasts
of the daily AO index at selected lead times are appended onto the time series. The indices are
standardized by standard deviation of the observed monthly AO index from 1979-2000. A 3-day running
mean is applied to the forecast time series.
The values at the upper left and right corners of each figure indicate the mean value of the AO
index and the correlation coefficients between the observations and the forecasts, respectively.
The first panel shows the observed AO index (black line) plus forecasted AO indices from
each of the 11 GFS ensemble members starting from the last day of the observations (red lines).
The ensemble mean forecasts of the AO index are obtained by averaging the 11 GFS ensemble members
(blue lines), and the observed AO index (black line) is superimposed on each panel
for comparison. For the forecasted indices (lower 3 panels), the yellow shading shows the
ensemble mean plus and minus one standard deviation among the ensemble members,
while the upper and lower red lines show the range of the forecasted indices, respectively.
Monthly average AO index since January 1950
In the following table all the monthly average values of AO index from 1950 to today.
With a red scale, values higher than +0.5 are highlighted, with a blue scale those lower than -0.5.
Below the table, a diagram again shows the AO values recorded.
| JAN | FEB | MAR | APR | MAY | JUN | JUL | AUG | SEP | OCT | NOV | DEC | |
|---|---|---|---|---|---|---|---|---|---|---|---|---|
| 1950 | -0.060 | +0.627 | -0.008 | +0.555 | +0.072 | +0.539 | -0.802 | -0.851 | +0.358 | -0.379 | -0.515 | -1.928 |
| 1951 | -0.085 | -0.400 | -1.934 | -0.776 | -0.863 | -0.918 | +0.090 | -0.377 | -0.818 | -0.213 | -0.069 | +1.987 |
| 1952 | +0.368 | -1.747 | -1.859 | +0.538 | -0.773 | -0.441 | +0.383 | -0.030 | -0.383 | -0.437 | -1.891 | -1.827 |
| 1953 | -1.036 | -0.249 | +1.068 | -1.256 | -0.562 | +0.022 | +0.333 | +0.085 | +0.662 | -0.195 | +0.354 | +0.576 |
| 1954 | -0.148 | -0.181 | +0.476 | +0.512 | -1.656 | -0.268 | +0.341 | -0.122 | +0.301 | +0.513 | -0.328 | +0.553 |
| 1955 | -1.163 | -1.542 | -1.568 | +0.194 | +0.242 | -0.266 | +0.332 | +0.760 | +0.357 | +0.099 | -1.342 | -0.444 |
| 1956 | -1.204 | -2.029 | +0.470 | -0.868 | +1.391 | +0.280 | -0.215 | -0.652 | -0.202 | +1.139 | -0.066 | +0.001 |
| 1957 | +2.062 | -1.513 | -2.013 | +0.238 | -0.966 | -0.760 | -0.646 | +0.097 | -0.956 | +0.903 | -1.380 | +0.828 |
| 1958 | -1.438 | -2.228 | -2.522 | -0.360 | -0.336 | -1.149 | -0.684 | -0.755 | -0.012 | +0.770 | -0.011 | -1.687 |
| 1959 | -2.013 | +2.545 | +1.432 | +0.119 | -0.341 | -0.033 | +0.105 | -0.745 | -0.281 | -0.249 | -1.411 | -0.042 |
| 1960 | -2.484 | -2.212 | -1.625 | -0.297 | -0.857 | +0.055 | -0.619 | -1.008 | -0.382 | -1.187 | -0.553 | -0.343 |
| 1961 | -1.506 | +0.621 | +0.341 | -0.237 | +0.158 | +0.837 | -0.108 | +0.013 | +0.815 | +0.203 | -0.010 | -1.668 |
| 1962 | +1.645 | -0.358 | -2.848 | +1.169 | +0.068 | +0.287 | -0.926 | +0.152 | -0.056 | -0.016 | -1.112 | -0.711 |
| 1963 | -3.311 | -1.721 | +0.724 | -0.348 | +0.771 | -0.585 | -0.303 | -0.625 | +0.083 | +1.069 | -0.419 | -1.178 |
| 1964 | +0.385 | -0.575 | -0.558 | +0.663 | +1.174 | +0.142 | +0.734 | -1.207 | -0.227 | +0.342 | -0.344 | -0.246 |
| 1965 | -1.046 | -2.084 | -0.905 | +0.568 | -0.152 | +0.038 | -0.510 | -0.255 | -0.698 | +0.394 | -1.341 | +0.163 |
| 1966 | -3.232 | -1.438 | -0.911 | -1.837 | +1.124 | +0.408 | +0.011 | -0.945 | +0.011 | -1.077 | +0.111 | -1.401 |
| 1967 | -0.576 | +1.180 | +1.967 | +1.700 | +0.127 | +0.647 | +0.259 | -0.293 | +0.133 | +1.299 | +0.334 | -0.347 |
| 1968 | -0.409 | -2.154 | +1.741 | +0.328 | -0.241 | +0.420 | -0.836 | -0.671 | -1.009 | -1.013 | -2.183 | -0.783 |
| 1969 | -2.967 | -3.114 | -1.582 | +0.439 | -0.720 | -0.348 | +0.409 | -0.782 | -0.083 | +0.098 | +0.326 | -1.856 |
| 1970 | -2.412 | -1.325 | -2.084 | +0.302 | +0.531 | +0.875 | +0.139 | -0.263 | +0.030 | +0.098 | +0.378 | -0.399 |
| 1971 | -0.163 | -0.922 | -1.091 | -0.583 | +0.679 | -0.668 | -0.579 | +0.818 | +0.153 | +1.185 | +0.419 | +0.824 |
| 1972 | +0.167 | -0.195 | -0.141 | +1.007 | +0.140 | -0.049 | -0.553 | -0.082 | -0.920 | +0.392 | -0.380 | +1.238 |
| 1973 | +1.232 | +0.786 | +0.537 | -1.126 | +0.073 | +0.531 | +0.271 | +0.312 | +0.114 | +0.337 | +0.002 | -0.181 |
| 1974 | +0.232 | -0.489 | -0.746 | +0.309 | -0.507 | -0.048 | +0.390 | -0.533 | -0.136 | -1.024 | -0.435 | +0.556 |
| 1975 | +1.595 | +0.195 | +0.151 | +0.409 | -0.614 | -0.323 | +0.345 | +0.130 | +1.278 | +0.138 | +0.619 | +1.290 |
| 1976 | +0.034 | +1.656 | +0.587 | +0.440 | +0.060 | +0.328 | -0.325 | +0.559 | -0.743 | -0.804 | -0.087 | -2.074 |
| 1977 | -3.767 | -2.010 | +0.344 | +1.329 | +0.104 | -0.226 | -0.492 | -1.412 | +0.587 | -0.009 | +0.605 | -0.240 |
| 1978 | -0.347 | -3.014 | +0.502 | -0.967 | +0.059 | +0.635 | -0.604 | -0.354 | -0.099 | +0.895 | +2.470 | -0.980 |
| 1979 | -2.233 | -0.697 | -0.814 | -1.157 | -0.250 | +0.933 | +0.038 | -0.684 | -0.046 | -1.243 | +0.475 | +1.295 |
| 1980 | -2.066 | -0.934 | -1.433 | -0.419 | -1.155 | +0.722 | -0.622 | -0.185 | +0.313 | -0.521 | -1.361 | -0.057 |
| 1981 | -0.116 | -0.332 | -1.645 | +0.430 | +0.180 | -0.438 | +0.560 | -0.244 | -1.040 | -1.167 | -0.188 | -1.216 |
| 1982 | -0.883 | +0.974 | +1.074 | +1.454 | -0.209 | -1.180 | +0.005 | +0.362 | +0.558 | -0.211 | +0.661 | +0.967 |
| 1983 | +1.359 | -1.806 | -0.567 | -0.738 | -0.441 | +0.312 | +0.131 | +1.098 | +0.167 | +1.369 | -0.688 | +0.186 |
| 1984 | +0.905 | -0.303 | -2.386 | -0.284 | +0.479 | +0.007 | +0.019 | +0.466 | -0.413 | -0.270 | -0.966 | +0.446 |
| 1985 | -2.806 | -1.440 | +0.551 | +0.652 | -0.432 | -0.347 | -0.390 | -0.001 | +0.114 | +1.035 | -1.218 | -1.948 |
| 1986 | -0.568 | -2.904 | +1.931 | +0.103 | +0.367 | +0.535 | -0.008 | -0.826 | -0.023 | +1.425 | +0.926 | +0.060 |
| 1987 | -1.148 | -1.473 | -1.746 | +0.387 | +0.325 | -0.710 | -0.466 | -0.836 | +0.286 | -0.080 | -0.536 | -0.534 |
| 1988 | +0.265 | -1.066 | -0.197 | -0.561 | -0.846 | +0.060 | -0.143 | +0.255 | +1.039 | +0.032 | -0.035 | +1.679 |
| 1989 | +3.106 | +3.279 | +1.530 | -0.250 | +0.889 | +0.345 | +0.866 | +0.551 | +0.703 | +0.991 | +0.034 | -0.644 |
| 1990 | +1.001 | +3.402 | +2.990 | +1.879 | +0.943 | +0.304 | -0.296 | -0.180 | -0.210 | +0.660 | +0.521 | +1.277 |
| 1991 | +0.723 | -0.876 | -0.527 | +0.530 | +0.486 | -0.115 | -0.188 | +0.797 | -0.112 | -0.252 | +0.285 | +1.613 |
| 1992 | +0.550 | +1.122 | +0.984 | -0.520 | +1.341 | -0.302 | +0.191 | +0.535 | -0.640 | -0.366 | +0.717 | +1.627 |
| 1993 | +3.495 | +0.184 | +0.764 | -0.435 | -1.607 | -0.519 | -0.511 | -0.393 | -0.361 | -0.565 | +1.002 | -0.104 |
| 1994 | -0.288 | -0.862 | +1.881 | +0.225 | -0.115 | +1.606 | +0.351 | +0.828 | -0.084 | +0.174 | +1.779 | +0.894 |
| 1995 | -0.154 | +1.429 | +0.393 | -0.963 | -0.891 | -0.112 | -0.217 | +0.544 | -0.549 | +0.075 | -0.723 | -2.127 |
| 1996 | -1.200 | +0.163 | -1.483 | -1.525 | -0.226 | +0.497 | +0.715 | +0.125 | -1.140 | +0.182 | +0.136 | -1.721 |
| 1997 | -0.457 | +1.889 | +1.091 | +0.324 | -0.961 | -0.815 | -0.431 | +0.121 | +0.195 | -0.700 | -0.661 | -0.071 |
| 1998 | -2.081 | -0.183 | -0.254 | -0.038 | +0.429 | -0.711 | -0.212 | +0.650 | -1.050 | +0.294 | -1.449 | +1.353 |
| 1999 | +0.110 | +0.482 | -1.492 | +0.284 | +0.226 | +0.707 | -0.002 | -0.672 | +0.059 | -0.006 | +0.611 | +1.043 |
| 2000 | +1.270 | +1.076 | -0.451 | -0.279 | +0.969 | +0.586 | -0.649 | +0.144 | +0.395 | +0.317 | -1.581 | -2.354 |
| 2001 | -0.959 | -0.622 | -1.687 | +0.906 | +0.452 | -0.015 | -0.031 | +0.520 | -0.707 | +0.708 | +0.819 | -1.322 |
| 2002 | +1.381 | +1.304 | +0.902 | +0.748 | +0.401 | +0.573 | +0.328 | -0.229 | -0.043 | -1.488 | -1.425 | -1.592 |
| 2003 | -0.472 | +0.128 | +0.933 | -0.178 | +1.017 | -0.102 | +0.075 | -0.280 | +0.467 | -0.670 | +0.642 | +0.265 |
| 2004 | -1.686 | -1.528 | +0.318 | -0.409 | -0.094 | -0.236 | -0.201 | -0.720 | +0.855 | -0.515 | +0.678 | +1.230 |
| 2005 | +0.356 | -1.271 | -1.348 | -0.046 | -0.763 | -0.383 | -0.030 | +0.026 | +0.802 | +0.030 | +0.228 | -2.104 |
| 2006 | -0.171 | -0.156 | -1.604 | +0.138 | +0.156 | +1.071 | +0.103 | -0.265 | +0.607 | -1.029 | +0.521 | +2.282 |
| 2007 | +2.034 | -1.307 | +1.182 | +0.544 | +0.894 | -0.555 | -0.397 | -0.034 | +0.179 | +0.384 | -0.519 | +0.821 |
| 2008 | +0.819 | +0.938 | +0.586 | -0.455 | -1.205 | -0.090 | -0.480 | -0.081 | -0.327 | +1.676 | +0.092 | +0.648 |
| 2009 | +0.800 | -0.672 | +0.121 | +0.973 | +1.194 | -1.351 | -1.356 | -0.054 | +0.875 | -1.540 | +0.459 | -3.413 |
| 2010 | -2.587 | -4.266 | -0.432 | -0.275 | -0.919 | -0.013 | +0.435 | -0.117 | -0.865 | -0.467 | -0.376 | -2.631 |
| 2011 | -1.683 | +1.575 | +1.424 | +2.275 | -0.035 | -0.858 | -0.472 | -1.063 | +0.665 | +0.800 | +1.459 | +2.221 |
| 2012 | -0.220 | -0.036 | +1.037 | -0.035 | +0.168 | -0.672 | +0.168 | +0.014 | +0.772 | -1.514 | -0.111 | -1.749 |
| 2013 | -0.610 | -1.007 | -3.185 | +0.322 | +0.494 | +0.549 | -0.011 | +0.154 | -0.461 | +0.263 | +2.029 | +1.475 |
| 2014 | -0.969 | +0.044 | +1.206 | +0.972 | +0.464 | -0.507 | -0.489 | -0.371 | +0.102 | -1.134 | -0.530 | +0.413 |
| 2015 | +1.092 | +1.043 | +1.837 | +1.216 | +0.763 | +0.427 | -1.108 | -0.689 | -0.165 | -0.250 | +1.945 | +1.444 |
| 2016 | -1.449 | -0.024 | +0.280 | -1.051 | -0.036 | +0.313 | +0.085 | +0.472 | +0.781 | -1.917 | -0.611 | +1.786 |
| 2017 | +0.942 | +0.340 | +1.365 | -0.089 | -0.730 | +0.402 | +0.634 | +0.150 | -0.492 | +0.690 | -0.078 | -0.059 |
| 2018 | -0.281 | +0.113 | -0.941 | +0.544 | +1.180 | +0.380 | +0.612 | +0.836 | +0.585 | +0.413 | -1.116 | +0.110 |
| 2019 | -0.713 | +1.149 | +2.116 | -0.255 | -1.231 | -0.601 | -0.890 | -0.722 | +0.306 | -0.082 | -1.193 | +0.412 |
| 2020 | +2.419 | +3.417 | +2.641 | +0.928 | -0.027 | -0.122 | -0.412 | -0.381 | +0.631 | -0.072 | +2.086 | -1.736 |
| 2021 | -2.484 | -1.191 | +2.109 | -0.204 | -0.161 | +0.845 | +0.630 | -0.209 | -0.252 | -0.146 | +0.093 | +0.198 |
| 2022 | +0.848 | +1.544 | +0.305 | -0.603 | +1.224 | -0.074 | +0.025 | -0.170 | -0.655 | +1.346 | +0.339 | -2.719 |
| 2023 | -0.674 | +1.600 | +0.280 | -0.973 | +1.134 | -0.286 | -0.154 | -0.602 | +0.318 | -0.414 | -0.036 | -0.222 |
| 2024 | -0.210 | +0.635 | -0.610 |
Standardized 3-Month Running Mean AO Index
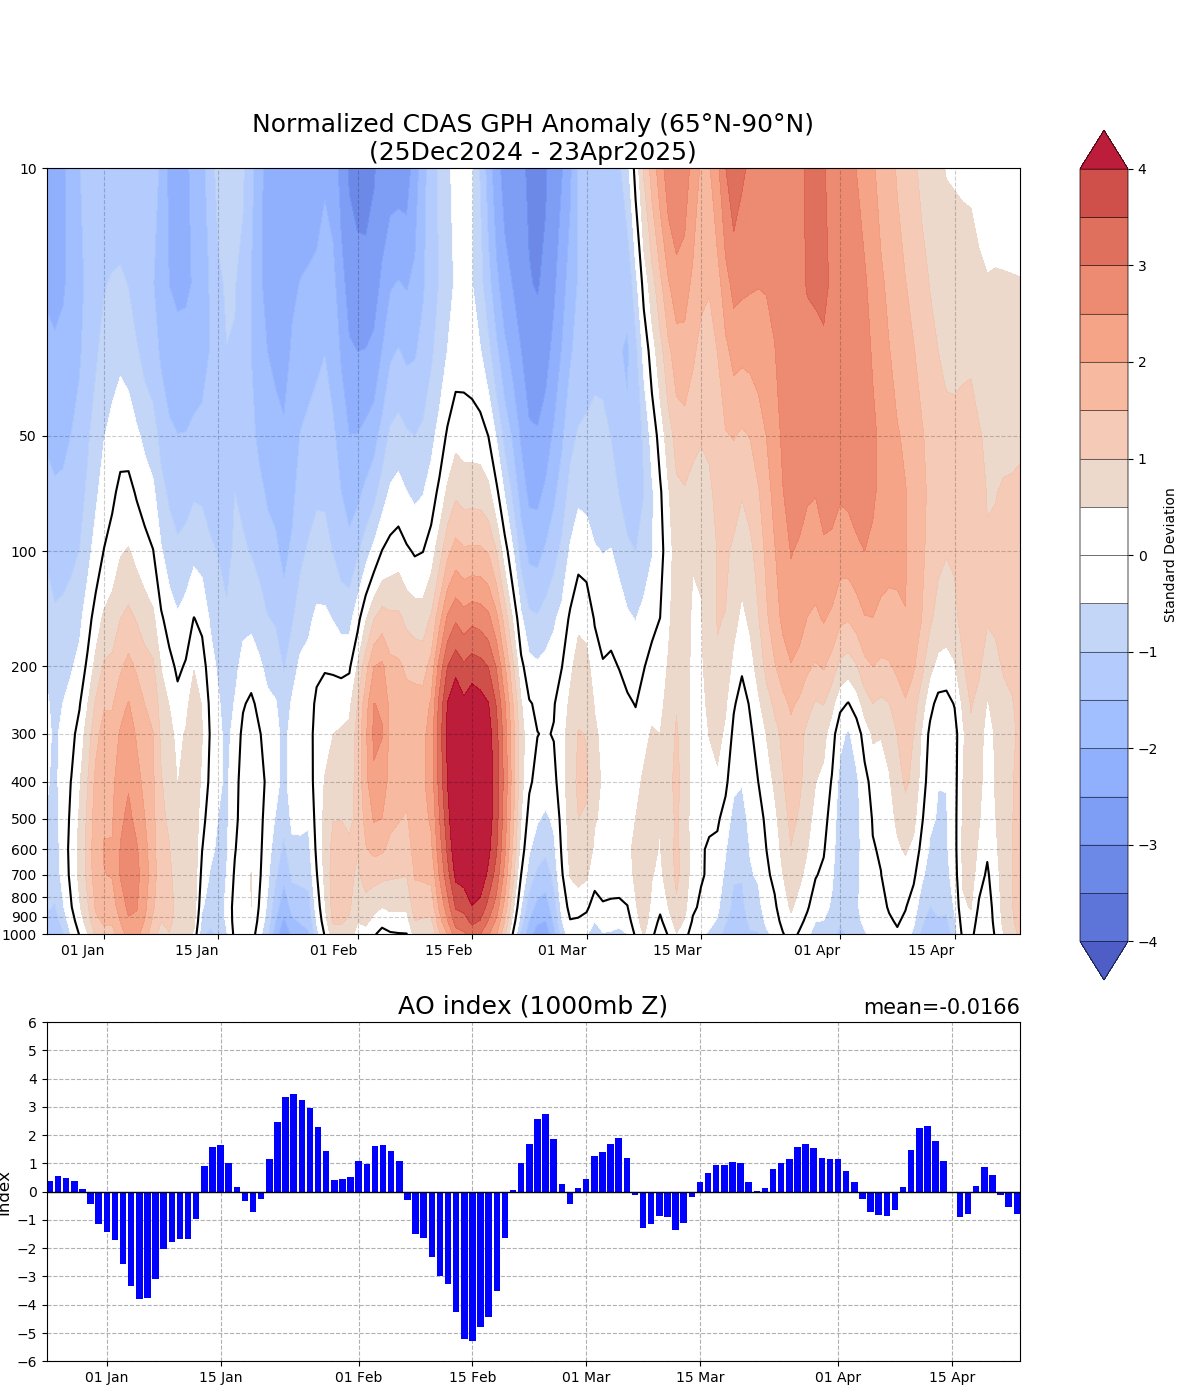
Vertical cross-section of geopotential height anomalies
The daily geopotential height anomalies at 14 pressure levels are shown for the previous
120 days as indicated, and they are normalized by standard deviation using 1979-2000 base period.
The anomalies are calculated by subtracting 1979-2000 daily climatology, and then averaged over the
polar cap poleward of 65°S.
The blue (red) colors represent a
strong (weak) polar vortex. The black solid lines show the zero anomalies.
The lower diagram shows the AO index calculated daily.