Intraseasonal oscillations
Teleconnective indices: intraseasonal oscillations
The variability in weather and climate ranges over many time and space scales, from small-scale
weather phenomena such as wind gusts, localized thunderstorms, and tornadoes to larger-scale
features such as low-pressure and high-pressure weather systems, to even more prolonged features
such as droughts and floods, to longer-lived climate phenomenon such as La Niño and La Niña,
to even
longer decadal trends. In general, the longer time-scale phenomena are often associated with changes
in the atmospheric circulation that encompass areas far larger than a particular affected region.
At times these persistent circulation features occur simultaneously over vast parts of the hemisphere,
or even the globe, and result in abnormal weather, temperature and rainfall patterns in many regions.
Scientists have discovered that important aspects of this variability are linked to global-scale phenomena
that affect the distribution and intensity of tropical rainfall, thereby influencing the position and
intensity of the subtropical high pressure regions and mid-latitude jet streams.
Year-to-year (interannual) variability in tropical rainfall is often related to the occurrence
of either the La Niño or La Niña phenomenon in the tropical Pacific. There is also
strong decade-to-decade
variability in tropical rainfall, which is thought to be an important source of interdecadal trends for
the atmospheric circulation and associated weather patterns.
Tropical rainfall also exhibits strong variability on sub-seasonal time scales. These fluctuations
in tropical rainfall often go through an entire cycle in 30-60 days, and are referred to as
"intraseasonal oscillations". Four other terms that are often used interchangeably to
refer to intraseasonal oscillations are "Madden-Julian Oscillation" or "MJO".
To learn more about the topic, we suggest reading
this page.
Intraseasonal fluctuations are a natural component of the planet's atmosphere-ocean system. They
significantly affect atmospheric circulation throughout the tropical and subtropical world,
and also strongly affect the winter jet stream and atmospheric circulation characteristics over
the North Pacific and western North America.
As a result, intraseasonal swings have a major impact on storms and temperatures across the
United States. During the summer these oscillations have a modulating effect on hurricane activity
in the Pacific and Atlantic basins. Therefore, it is very important to monitor and forecast intraseasonal
activity, as this activity has profound implications for short-term weather and climate variability
over the course of the year.
This page offers various useful tools for monitoring intra-seasonal fluctuations.
IR temperature animation
3-day loop of merged METEOSAT-5, GMS, GOES 10, and GOES 8 satellite IR temperature data. Loops consist of images at 3-hour intervals over 3-day periods as indicated. Data Sources are "window" channel IR. Coldest cloud-top temperatures are indicated by blues, yellows, and reds, with reds indicating coldest temperatures and deepest convection.
Credits: cpc.ncep.noaa.gov
200-hPa height anomalies
30-day loop of analyzed 200-hPa heights and anomalies. An eleven-day mean, centered on the date indicated in the title, of 200-hPa heights and anomalies from the NCEP Climate Data Assimilation System (CDAS), is shown for the first 25 days of the animation. 10-, 9-, 8-, 7-, and 6-day running means are shown for the last 5 days, respectively. Contour interval for heights is 120 m, anomalies are indicated by shading. Anomalies are departures from the 1991-2020 daily base period means.
Credits: cpc.ncep.noaa.gov
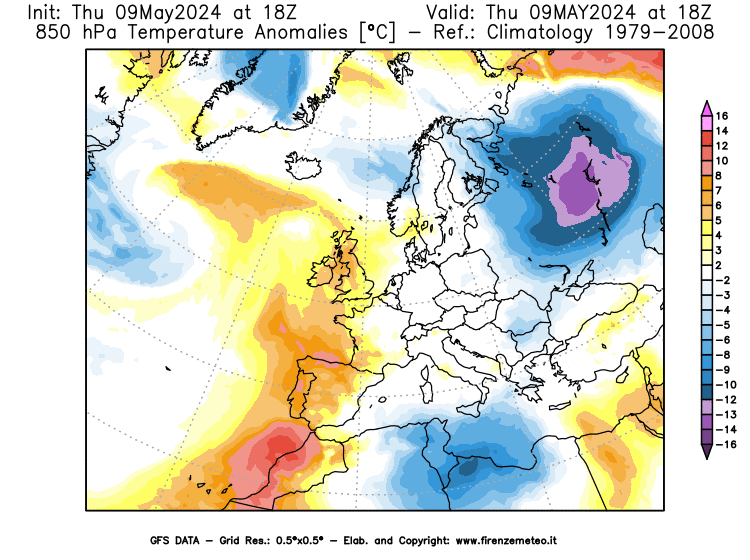
500-hPa height anomalies - Northern hemisphere
30-day loop of analyzed 500-hPa heights and anomalies. Each frame is an five-day mean, centered on the date indicated in the title, of 500-hPa heights and anomalies from the NCEP Climate Data Assimilation System (CDAS). Contour interval for heights is 120 m, anomalies are indicated by shading. Anomalies are departures from the 1991-2020 daily base period means.
Credits: cpc.ncep.noaa.gov
500-hPa height anomalies - Southern hemisphere
30-day loop of analyzed 500-hPa heights and anomalies. Each frame is an five-day mean, centered on the date indicated in the title, of 500-hPa heights and anomalies from the NCEP Climate Data Assimilation System (CDAS). Contour interval for heights is 120 m, anomalies are indicated by shading. Anomalies are departures from the 1991-2020 daily base period means.

Credits: cpc.ncep.noaa.gov
Daily IR and 200-hPa velocity potential anomalies
Three-day centered average animation of daily infra-red (IR) and 200-hPa velocity potential anomalies (base period 1991-2020). Velocity potential anomalies are proportional to divergence with green (brown) contours corresponding to regions in which convection tends to be enhanced (suppressed).
Credits: cpc.ncep.noaa.gov
200-hPa heights and wind speed
Five day mean values of 200-hPa height (m, contour interval is 120 m) and wind speed (shaded, m s-1).
Credits: cpc.ncep.noaa.gov
500-hPa heights and and anomalies
5-day mean values of 500-hPa heights (contour, interval is 120 m) and anomalies (shading). Anomalies are departures from the 1979-95 base period daily means.
Credits: cpc.ncep.noaa.gov
Outgoing long wave radiation (OLR) anomalies
Time-longitude section (5S-5N) of anomalous 10-90 day band pass filtered outgoing long wave radiation (OLR). Contour interval is 10 W m-2. The data are smoothed by using a 3-point running average. Negative (positive) OLR anomalies indicate enhanced (suppressed) convection.
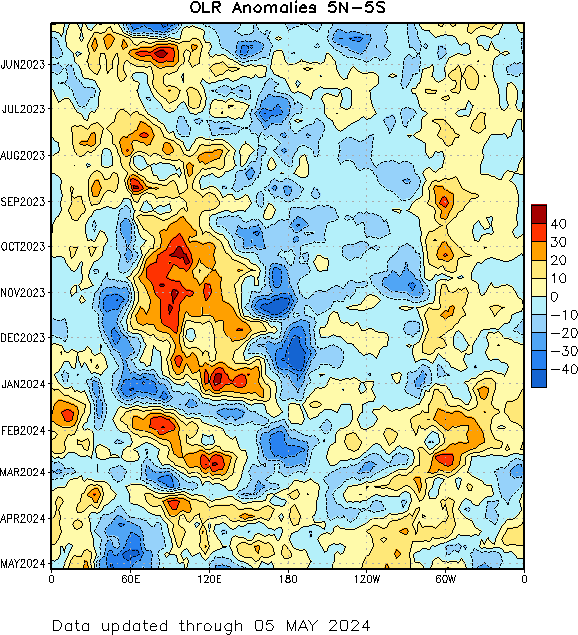
Credits: cpc.ncep.noaa.gov
Equatorial 200-hPa velocity potential anomaly
Five day running mean time longitude sections of the 200-hPa velocity potential anomaly (5N-5S) calculated from daily anomalies. On the left diagram the total anomaly is shown, while on the right one the period mean removed at each longitude is shown. Anomalies are departures from the 1991-2020 base period daily means.
Credits: cpc.ncep.noaa.gov
Equatorial 850-hPa zonal wind anomalies
Five day running mean time longitude section of 850-hPa zonal wind anomalies (5°S-5°N) calculated from daily anomalies. Anomalies are departures from the 1991-2020 base period daily means.
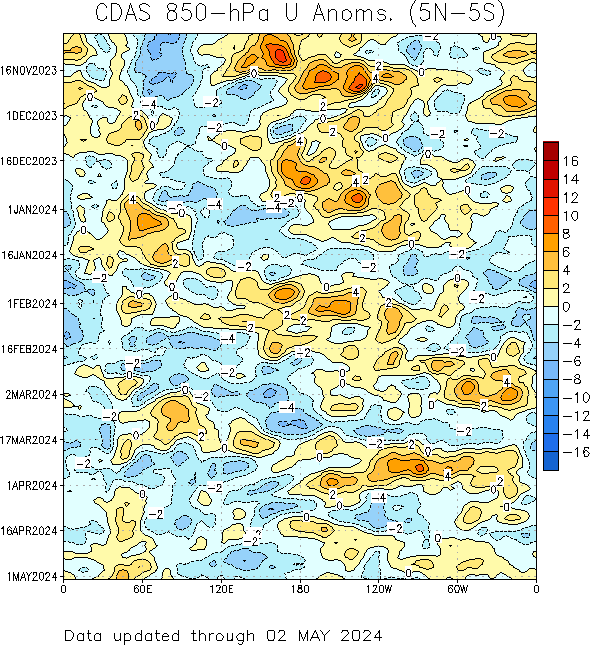
Credits: cpc.ncep.noaa.gov
Equatorial atmosphere average heat content anomalies
Time-longitude section of the upper ocean (0-300 m) average heat content anomalies along the equator calculated using pentad data. Anomalies are departures from the 1991-2020 base period pentad means.

Credits: cpc.ncep.noaa.gov
500-hPa height anomalies at middle latitudes
Five day running mean time longitude section of the 500-hPa height anomalies (45°N-60°N and 45°S-60°S) calculated from daily anomalies. Anomalies are departures from the 1981-2010 base period daily means.
Credits: cpc.ncep.noaa.gov
Credits: cpc.ncep.noaa.gov
500-hPa height anomalies at high latitudes
Five day running mean time longitude section of the 500-hPa height anomalies (60°N-90°N and 60°S-90°S) calculated from daily anomalies. Anomalies are departures from the 1981-2010 base period daily means.
Credits: cpc.ncep.noaa.gov
Credits: cpc.ncep.noaa.gov