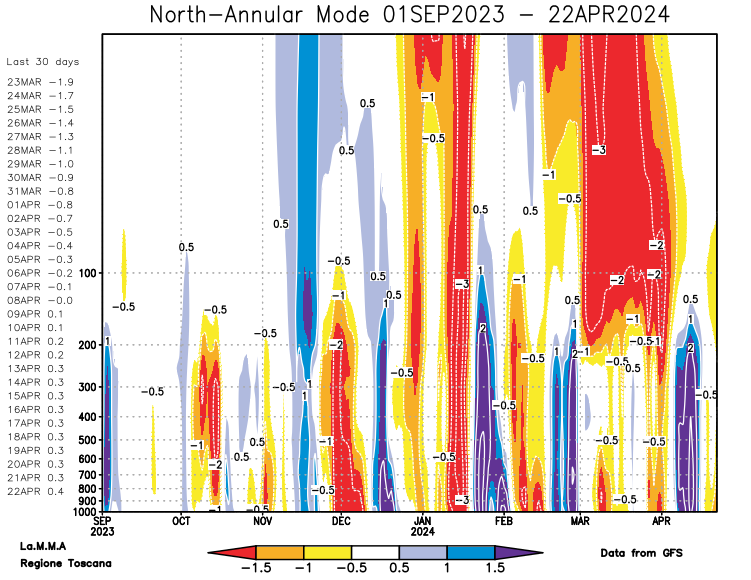
North Annular Mode [NAM]
Teleconnective indices - North Annular Mode [NAM]
The North Annular Mode (NAM)) - also Northern Hemisphere annular mode - is a large-scale
index of climate variability. The NAM is calculated by projecting the daily geopotential
anomalies between 20° N and 90°N to the Arctic oscillation pattern
defined by an empirical function of the monthly geopotential averages during the period.
The calculation of the NAM is performed at different pressure levels, starting from the troposphere up
to the stratosphere. The NAM at sea level (1000 hPa) coincides with the
Arctic Oscillation Index (AO), to which this page is dedicated.
When the NAM is in its positive phase (NAM+), high geopotentials
are observed in the mid-latitudes and low in the polar latitudes and very low temperatures in the
stratosphere (stratcooling). With this configuration, the stratospheric polar vortex is deep,
that is characterized by particularly strong western currents, not very wavy and therefore with consequent reduced
heat exchange with the lower latitudes. The colder air therefore remains confined to the polar regions.
In the opposite phase (NAM-), low geopotentials in the mid-latitudes will be observed,
while the polar regions will be characterized by high geopotentials. In this situation the stratosphere
will register temperatures higher than usual which can also lead to the phenomenon of stratwarming
(NAM close to the value -3), that is a rapid and significant warming of the stratosphere.
This page is dedicated to the observation
of possible stratwarming events. In a phase of NAM- frequent
outbreaks of cold air towards the middle latitudes can be recorded.


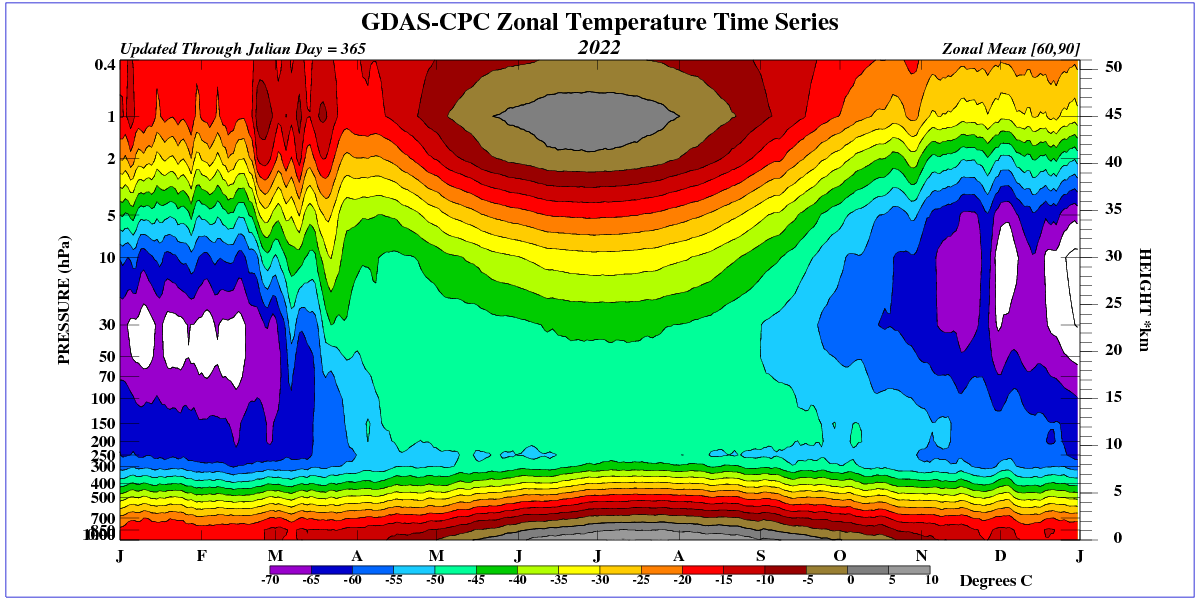
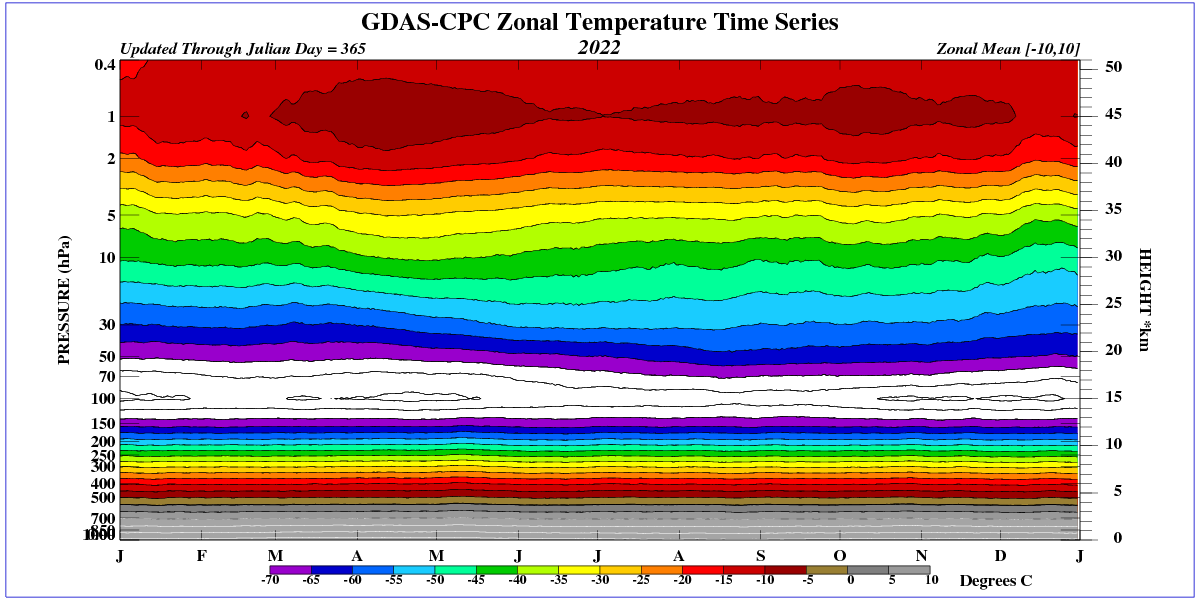
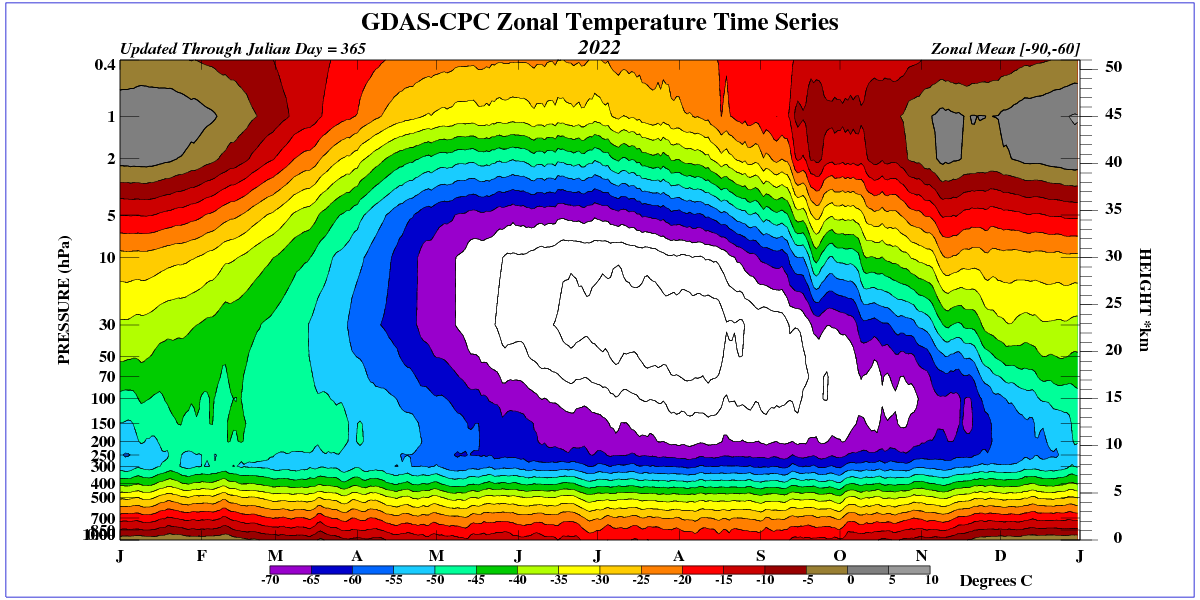
North Annular Mode Diagrams
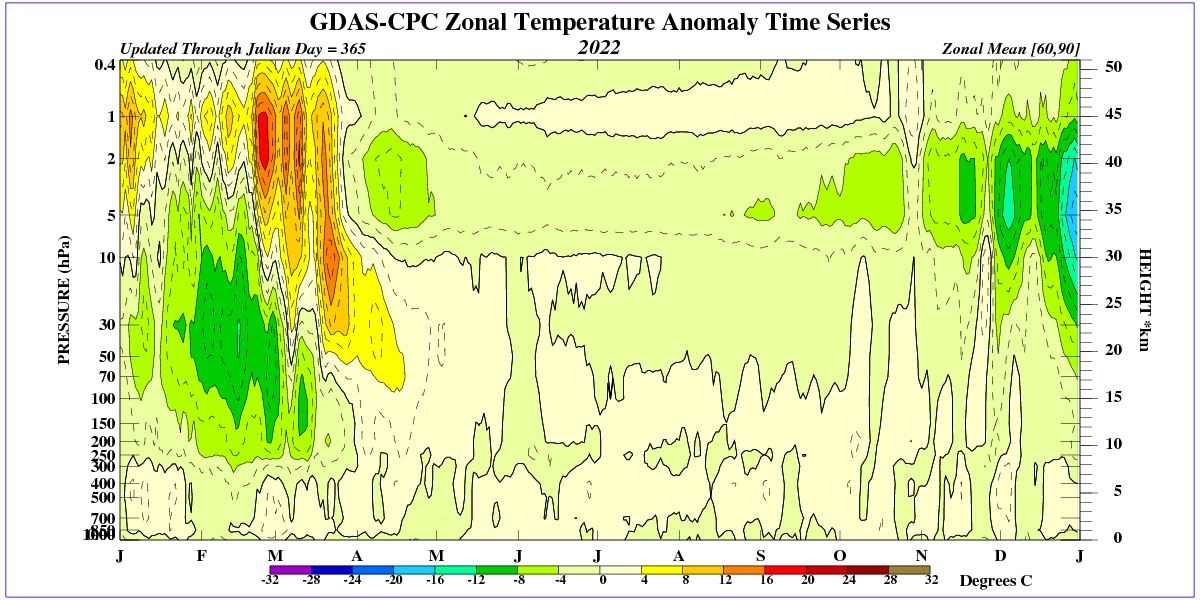
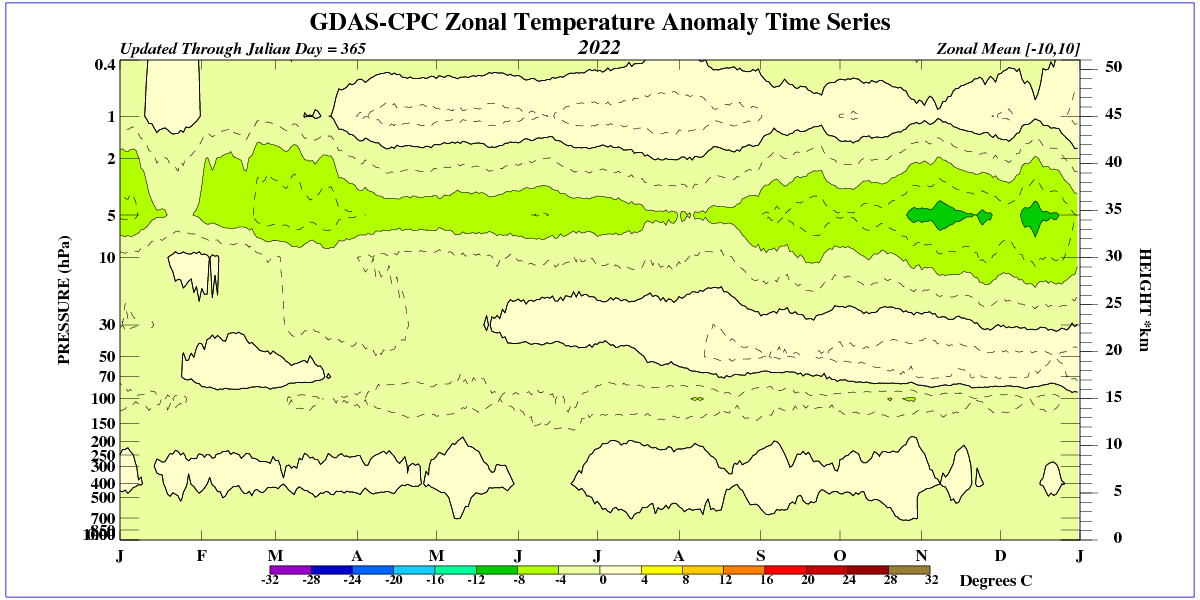
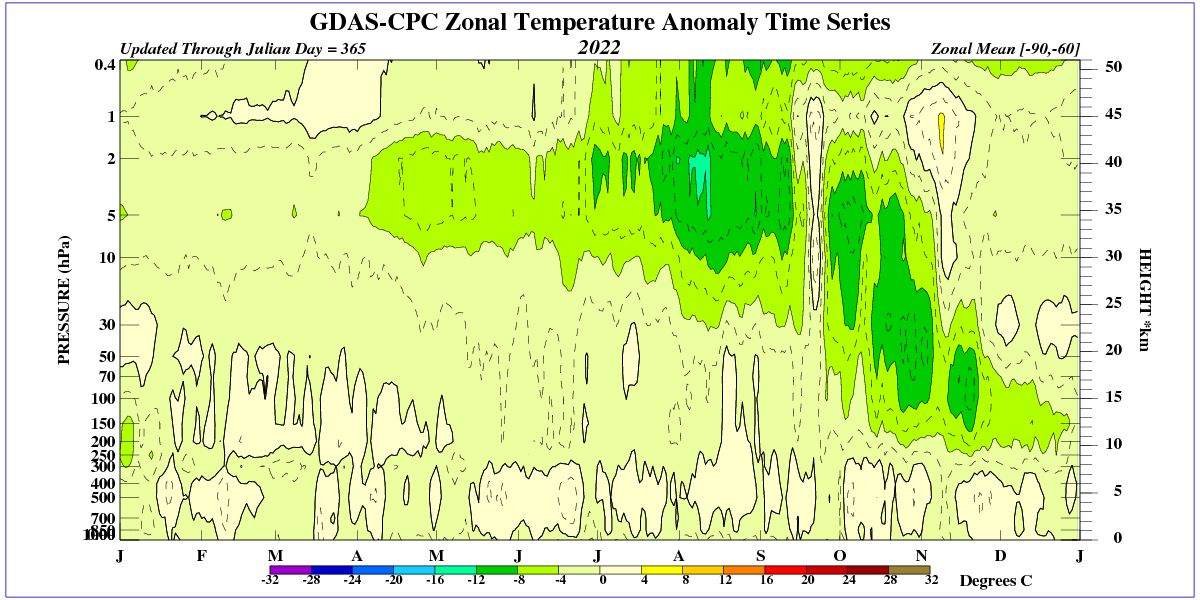
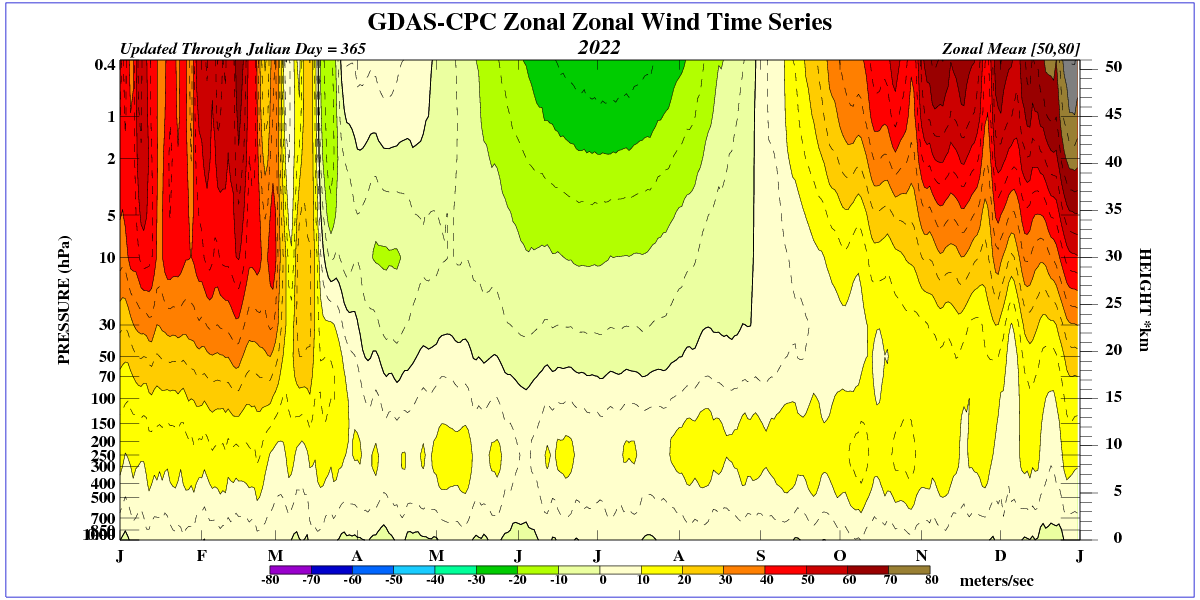
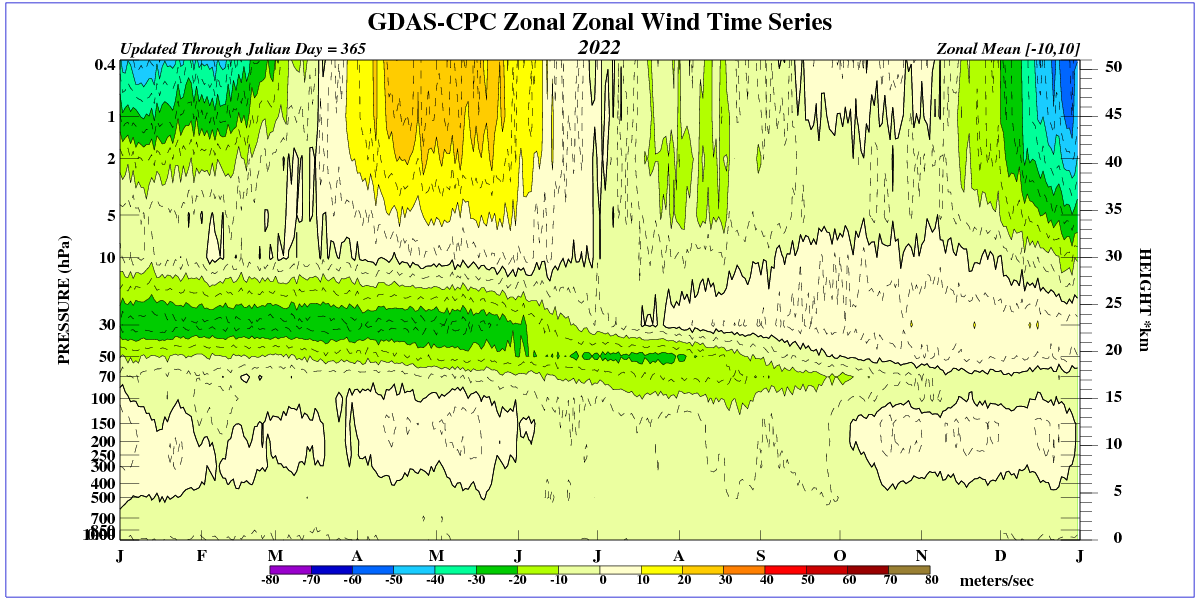
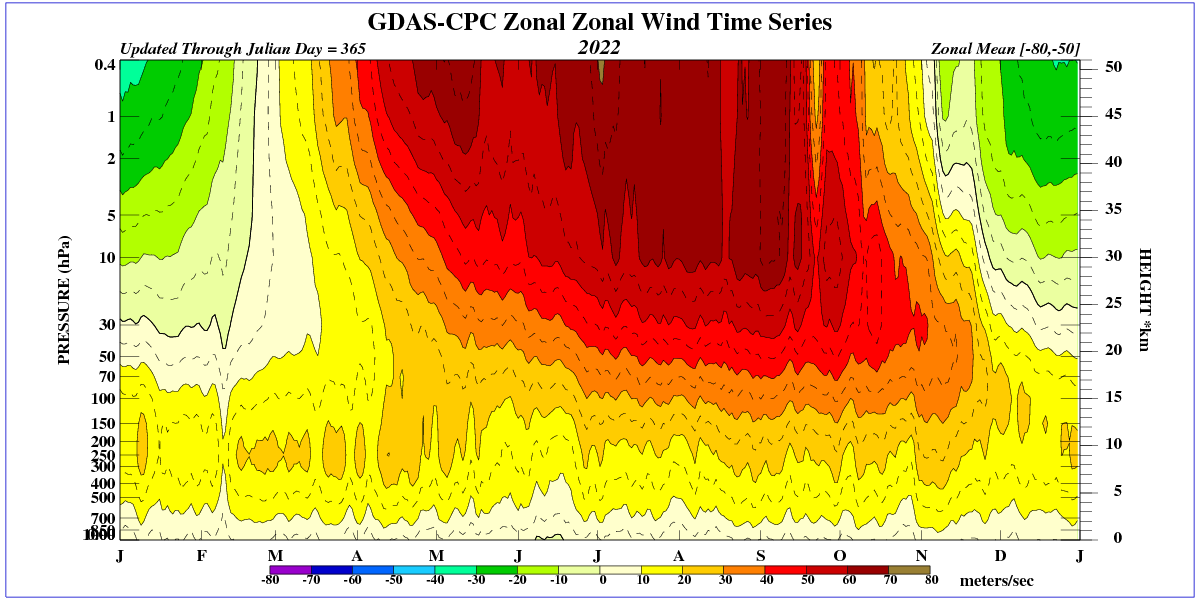
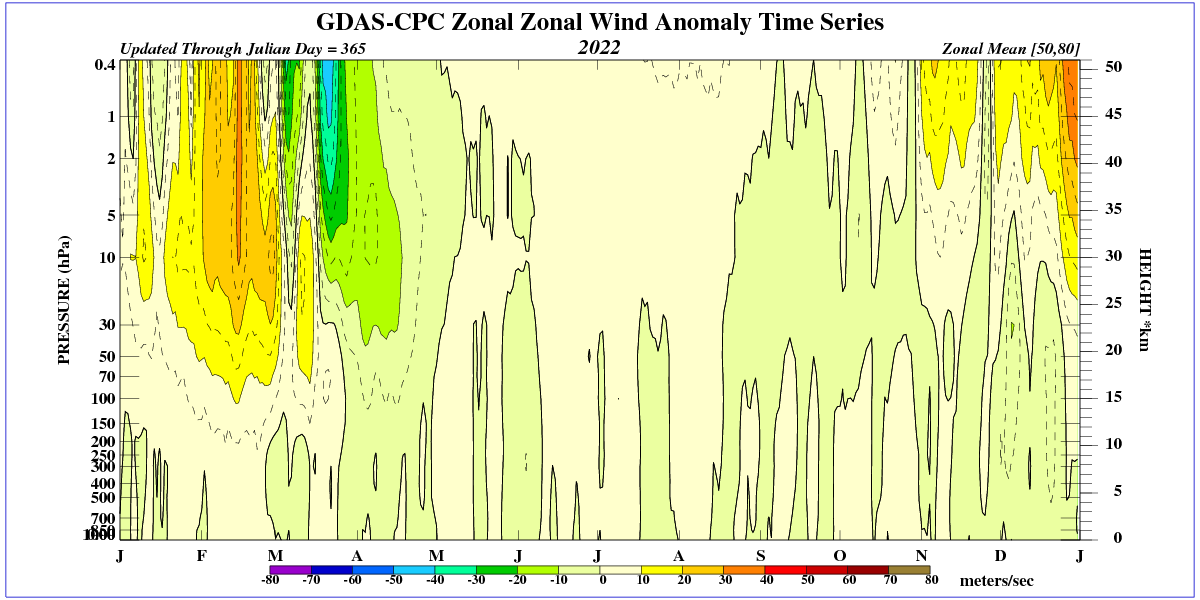
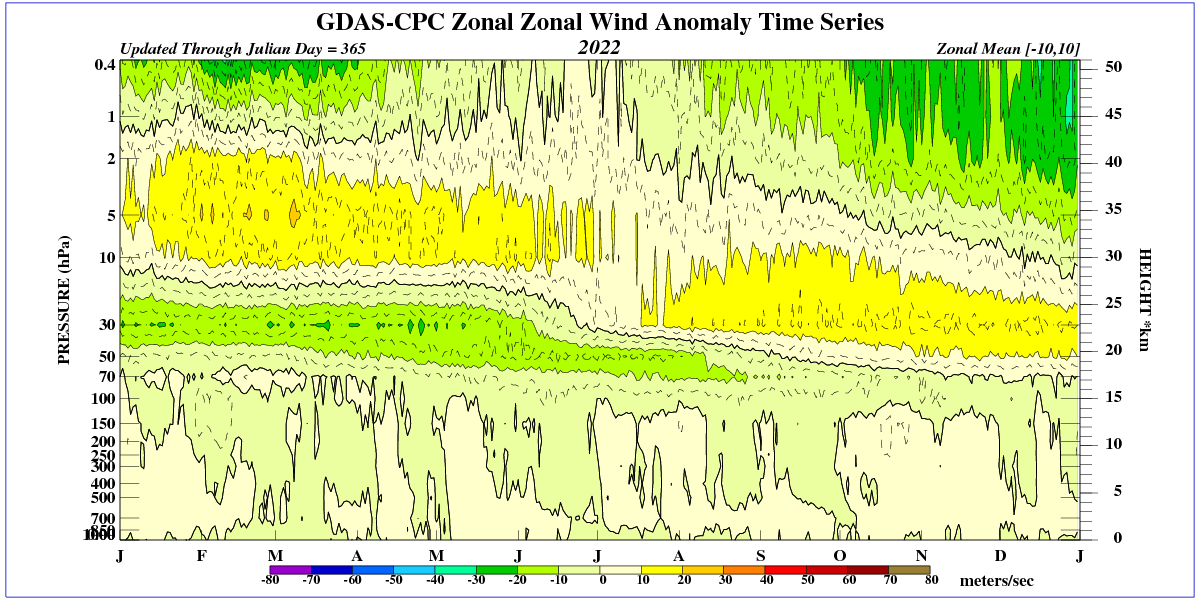
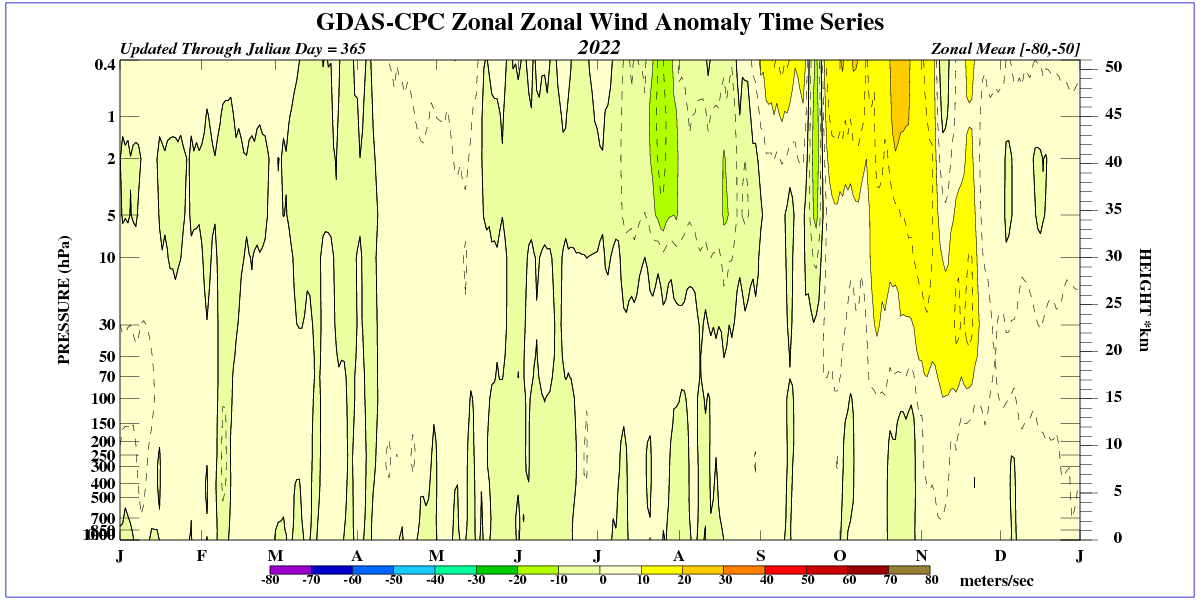
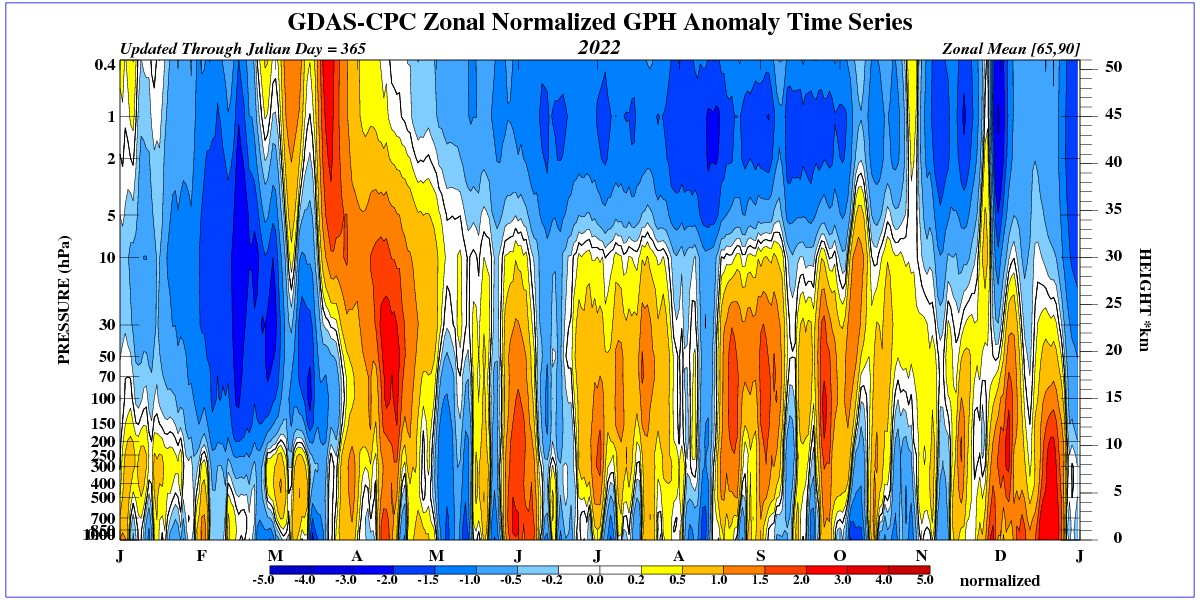
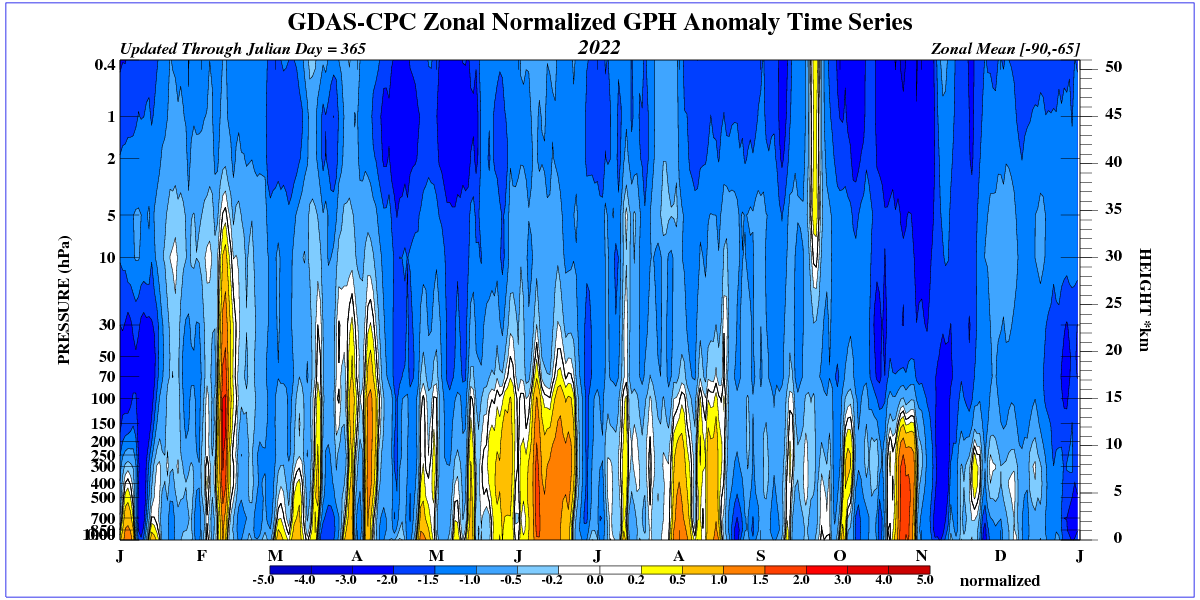
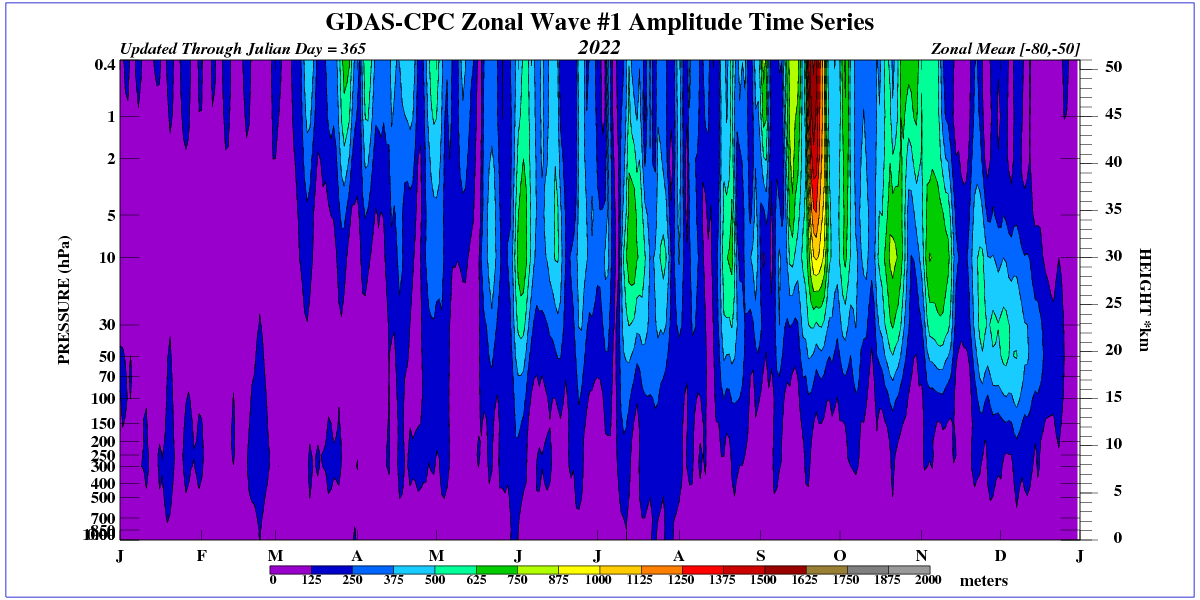
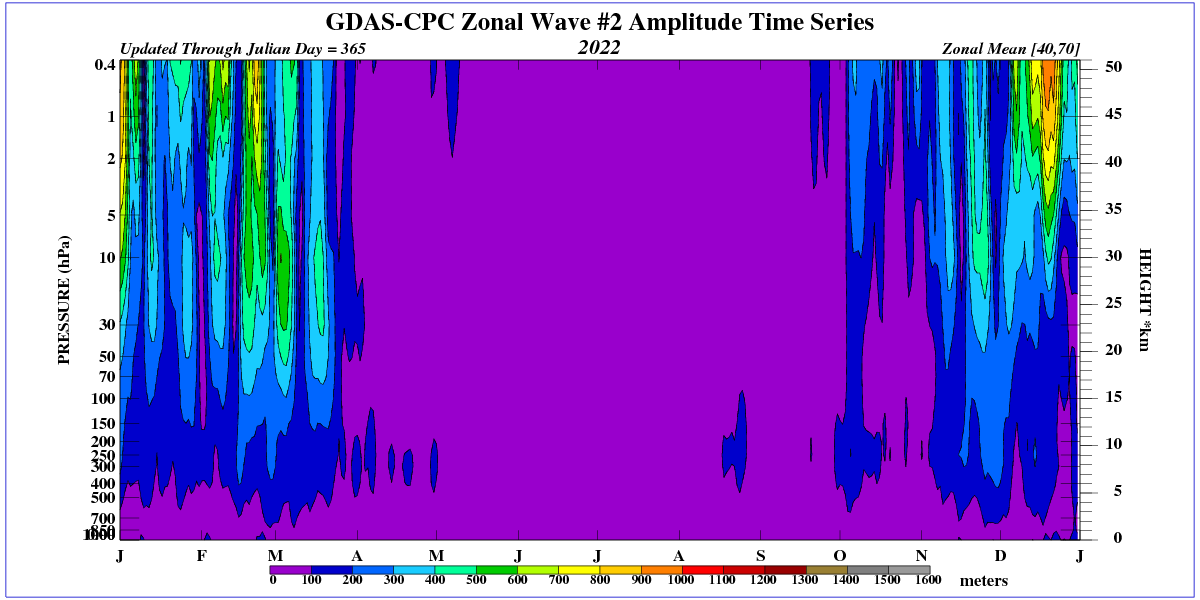
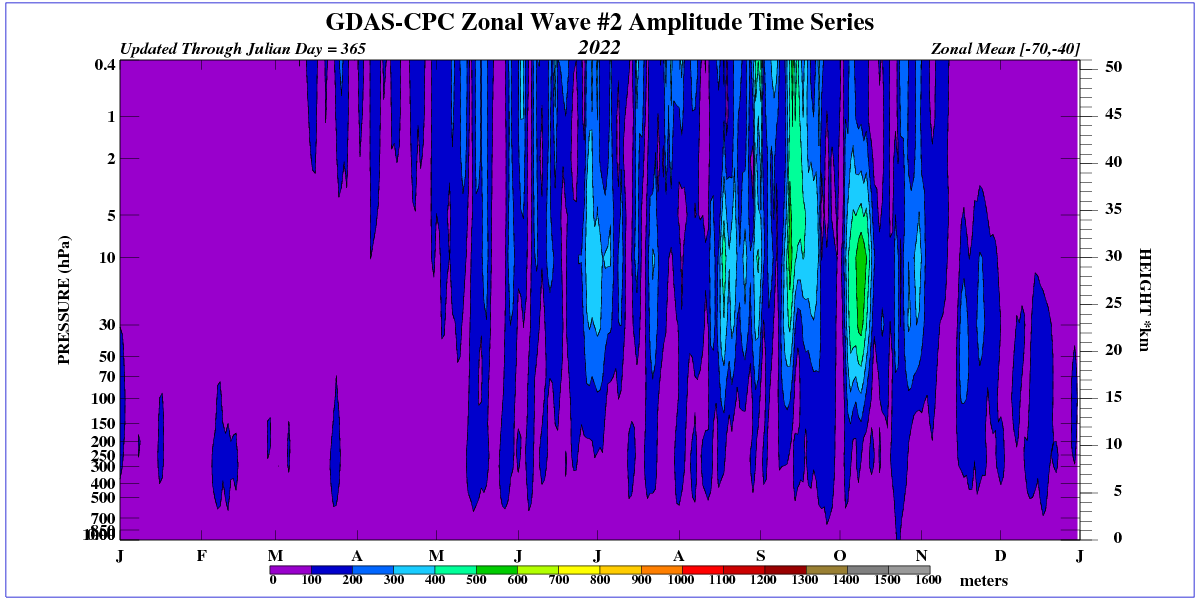
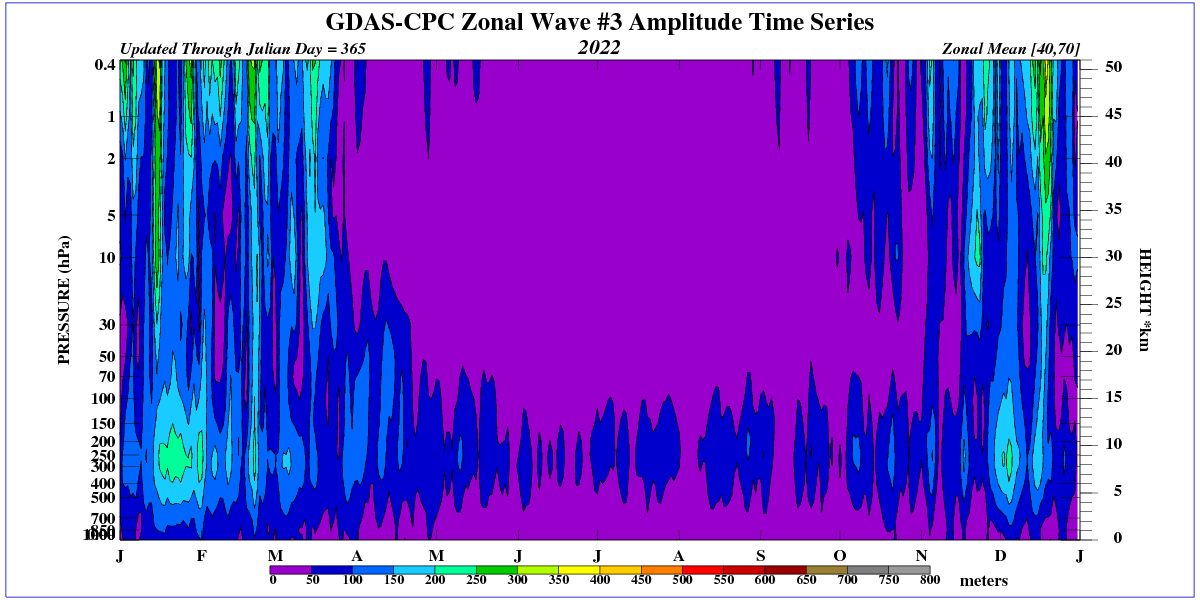
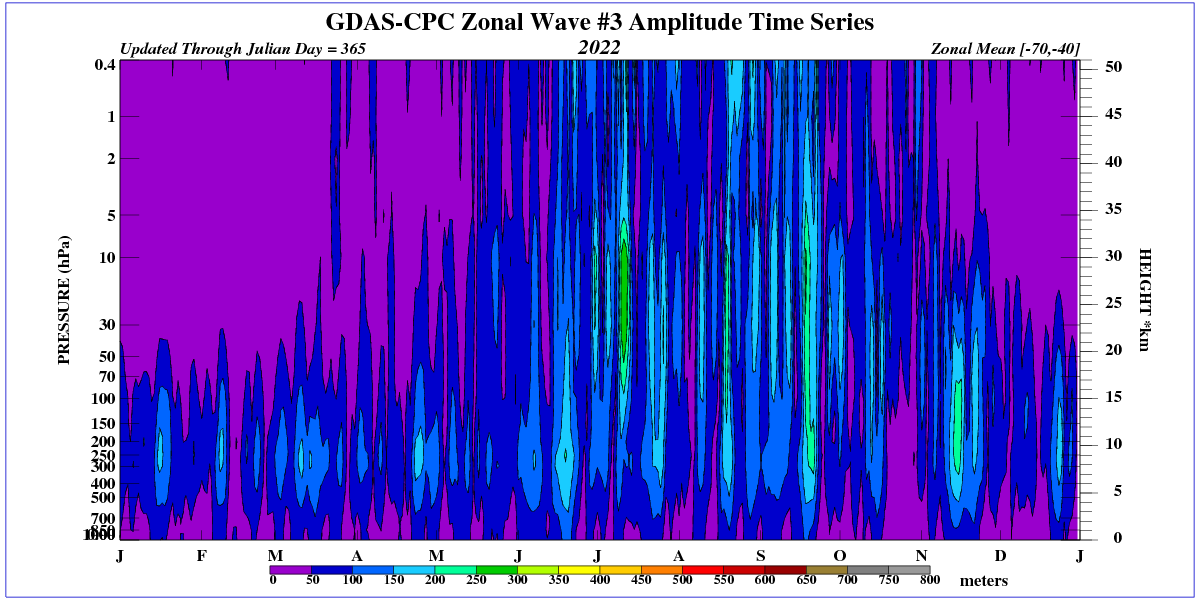
The NCEP GDAS and CPC temperature and height analyses are used to monitor processes in the Stratosphere and Troposphere. In the table below are zonal mean time series of Temperature, Zonal Wind Component, Normalized Geopotential Height anomalies, amplitude of the height field's Wave 1, Wave 2, and Wave 3.

North Annular Mode - Past 12 months Values
Diagram of NAM values from sea level to the stratosphere. Stratospheric warming events are highlighted with warm color tones