Artic Ocean ice extent: analysis and forecasts. Arctic ice cap analysis.
Arctic sea ice extension, seasonal cycle
This page shows some graphs and charts of the Arctic ice pack, i.e. the ice pack covering the
Arctic region around the North Pole.
The extent of the Arctic sea ice follows seasonal thermal cycles, oscillating between a minimum
in September and a maximum in March. The 1981-2010 average has a maximum of approximately
15,500,000 km2 and a minimum extent of approximately 6,300,000 km2.
According to the annual data available
on this page, 2022 fluctuated between a maximum of
14,875,000 km2 on 24 February (ahead of the average) and a minimum of
4,674,000 km2 on 18 September. The lowest extent was observed on 17 September 2012
with 3,387,000 km2.

Credits: nsidc.org
Current ice extent in the Arctic Sea: 2024 updated situation
The following graph shows the current Arctic sea ice extent, compared both with the 1981-2010 average and with the last 10 years average. As reported in the caption, an area with at least 15% ice is considered frozen, so the real extent of the ice is less.

Credits: nsidc.org
Map of the artic sea extent and comparison with the 1981-2020 mean (orange line).

Credits: nsidc.org
Map of extent and concentration of the Artice Ocean ice and comparison with the 1981-2020 mean (orange line).
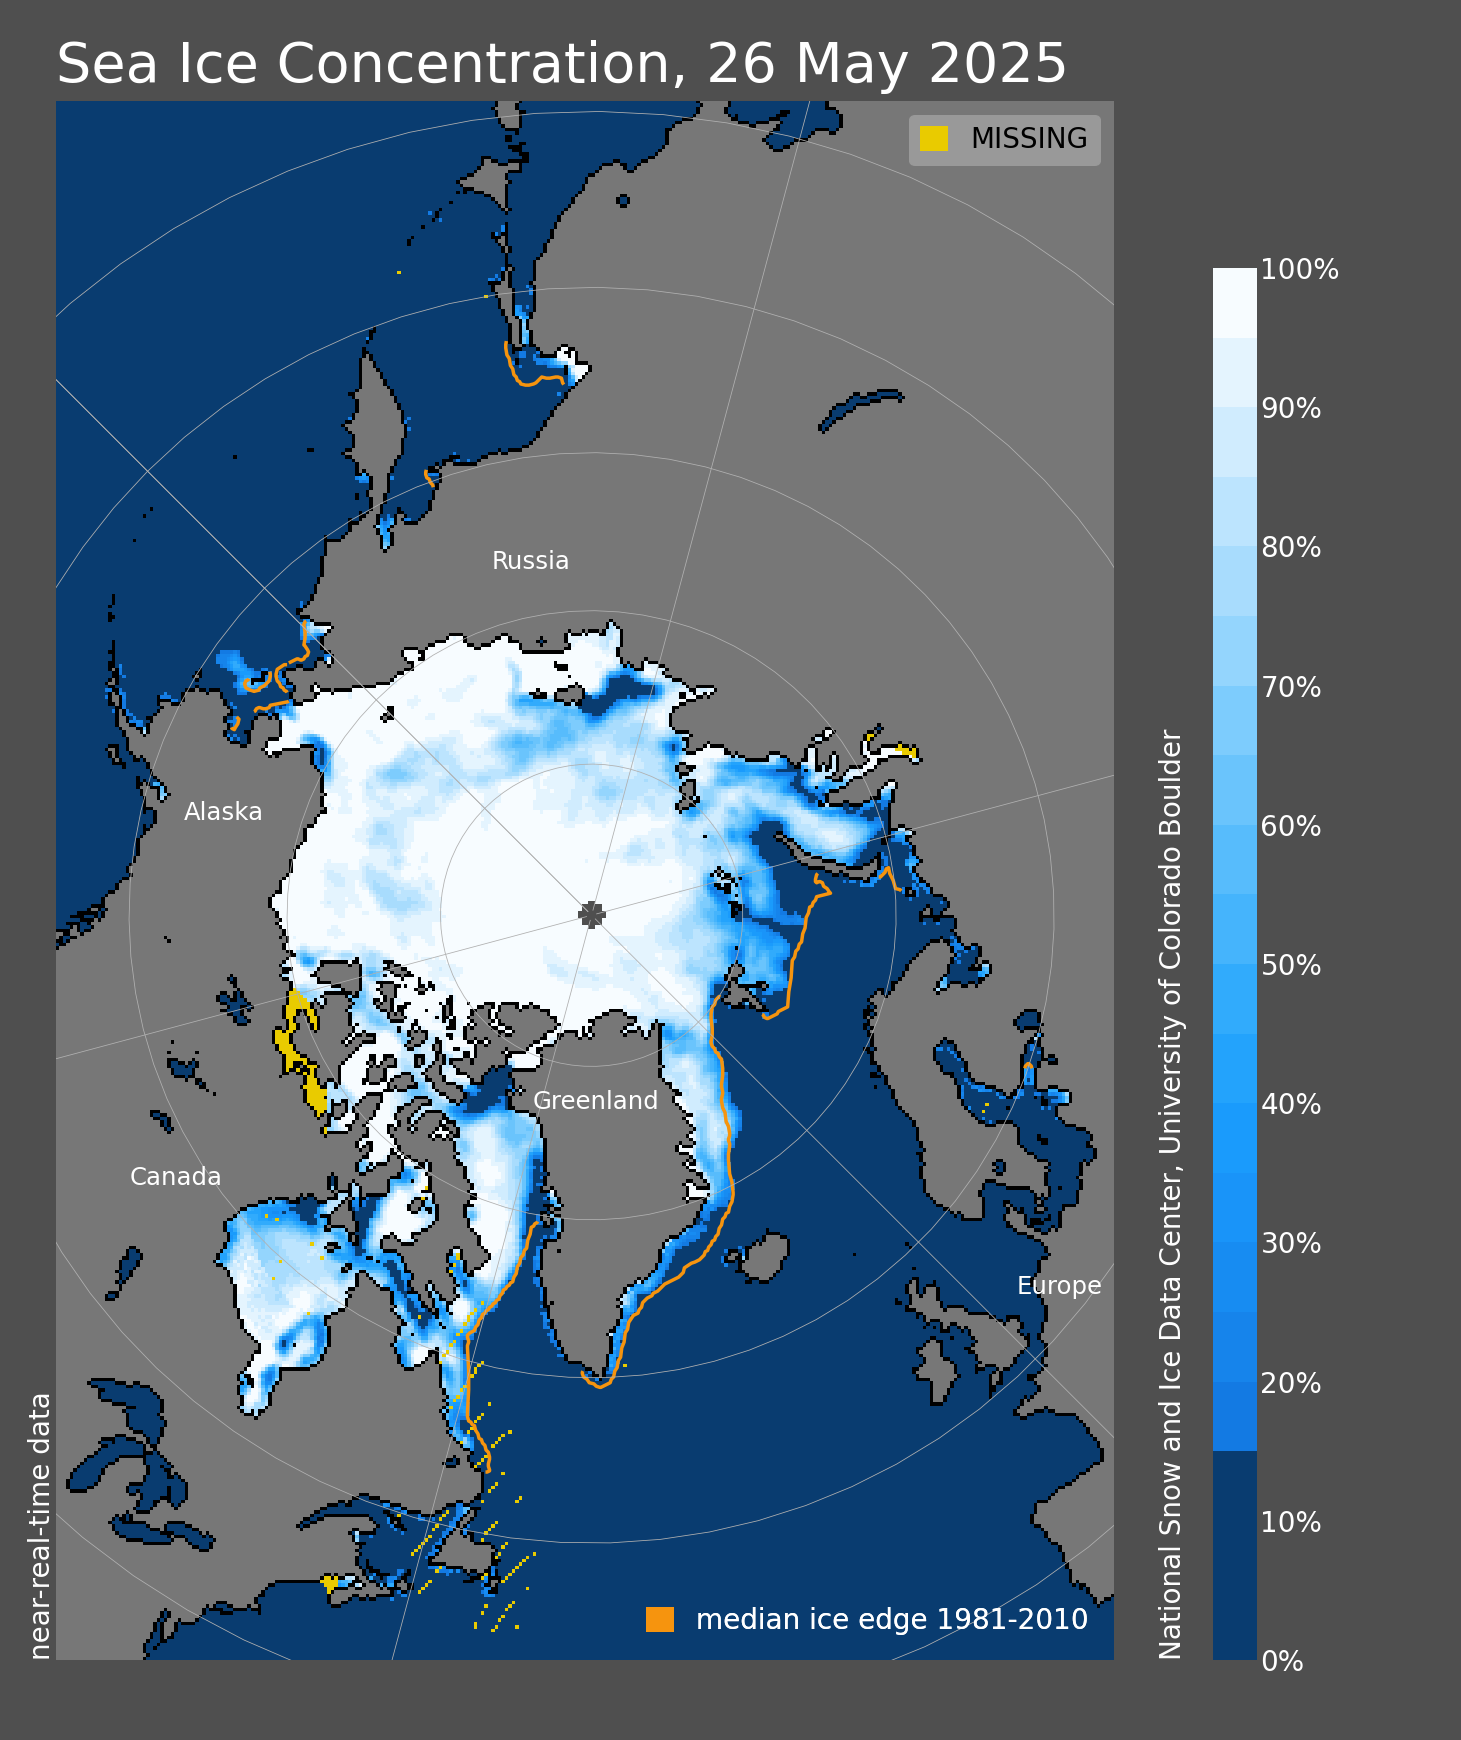
Credits: nsidc.org
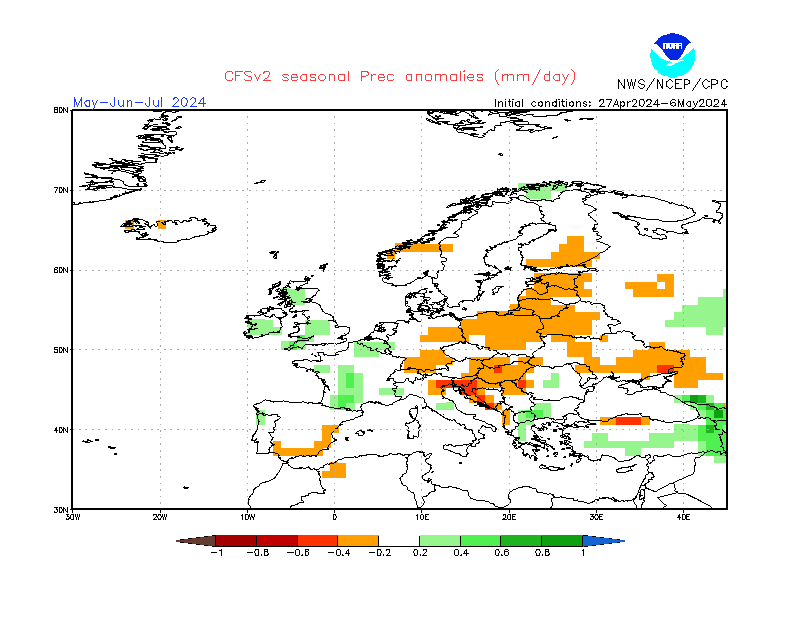
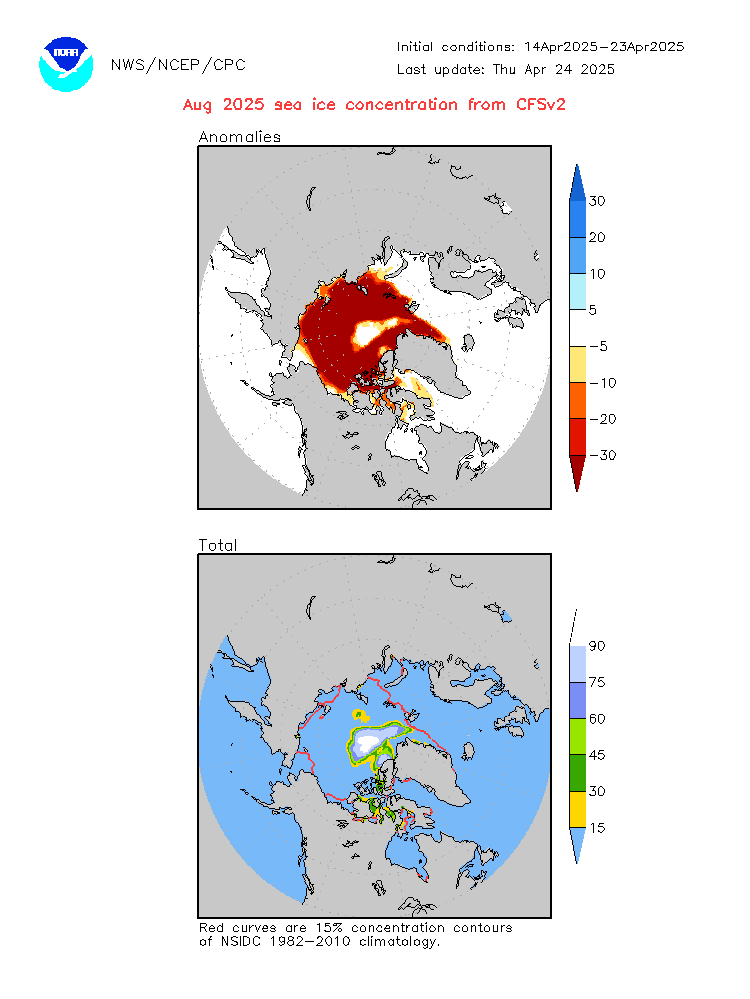
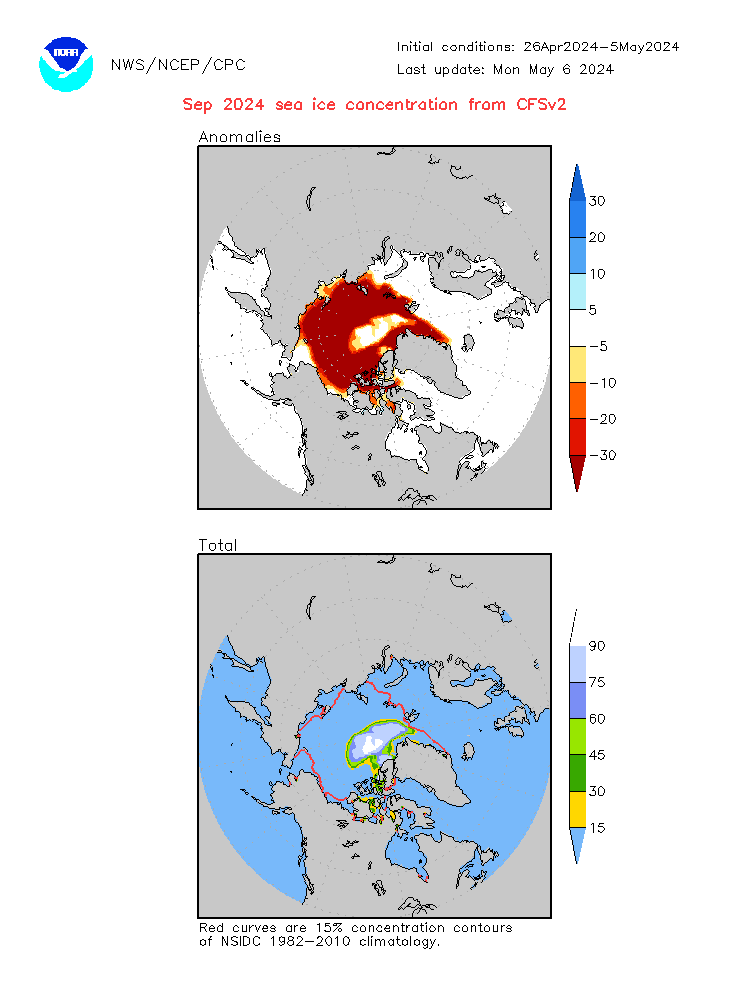
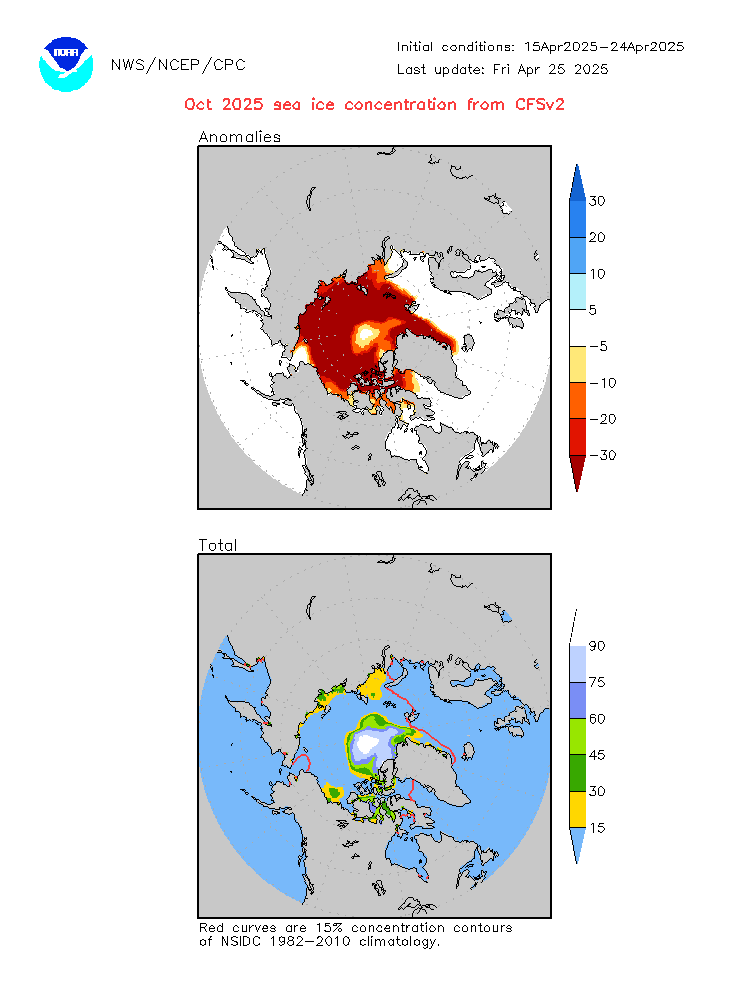
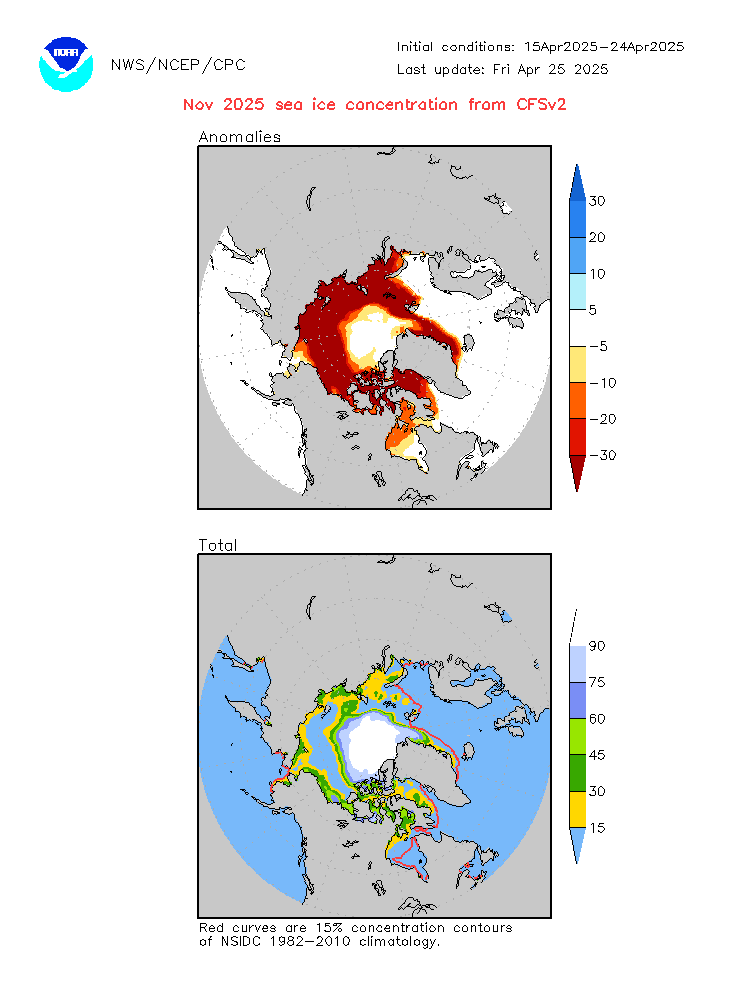
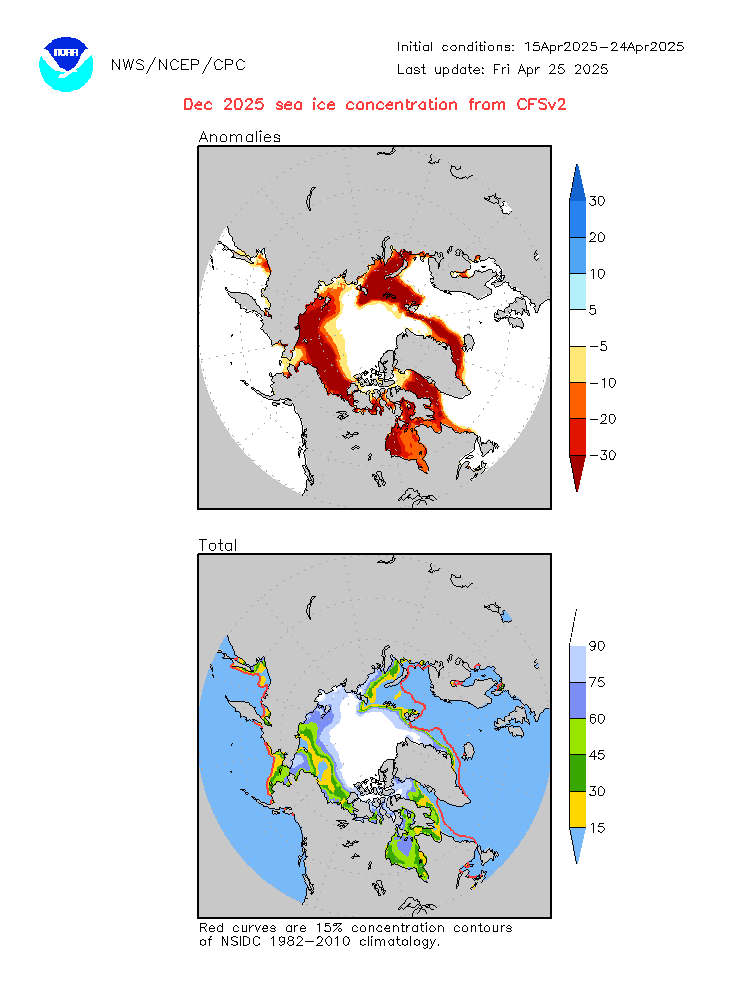
Maps of Arctic sea ice extent forecast
The following maps show the forecasts for the next months Arctic Sea ice extent. In the upper figure the anomalies, in the lower figure the total concentration up to a minimum of 15% (red line).

Credits: cpc.ncep.noaa.gov
Credits: cpc.ncep.noaa.gov
Credits: cpc.ncep.noaa.gov
Credits: cpc.ncep.noaa.gov
Credits: cpc.ncep.noaa.gov
Credits: cpc.ncep.noaa.gov
Total ice extent in the Arctic Sea: next 6 month forecasts
The following diagram shows the total Arctic sea ice extent 2forecasted for the next 6 months. Above, the anomaly respect to the 1981-2010 average, below, the total extent.
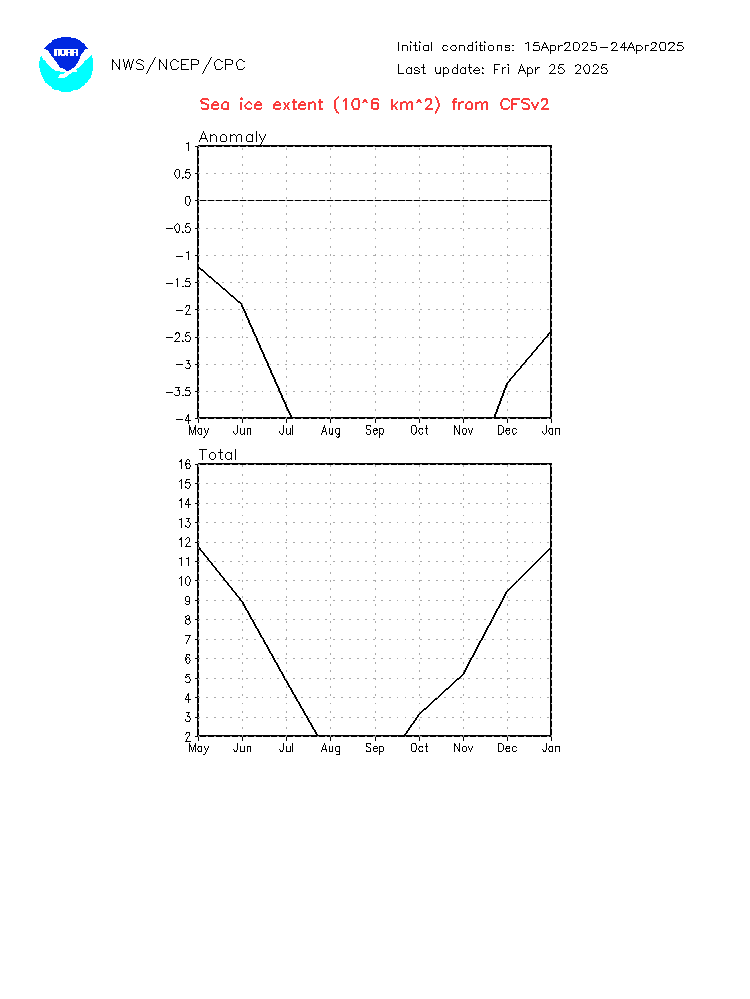
Credits: cpc.ncep.noaa.gov