Pacific North-America pattern (PNA)
Teleconnective indices: Pacific North-America [PNA]
The Pacific North American teleconnection (PNA) is a large-scale climatological
model that relates the atmospheric circulation pattern over the North Pacific Ocean to that of the
North American continent.
Positive PNA (PNA+) correspond to higher than normal geopotential heights near the
Hawaiian Islands and along the Rocky Mountain. The negative anomaly centers are located just
south of the Aleutian Islands and in the southeastern United States.
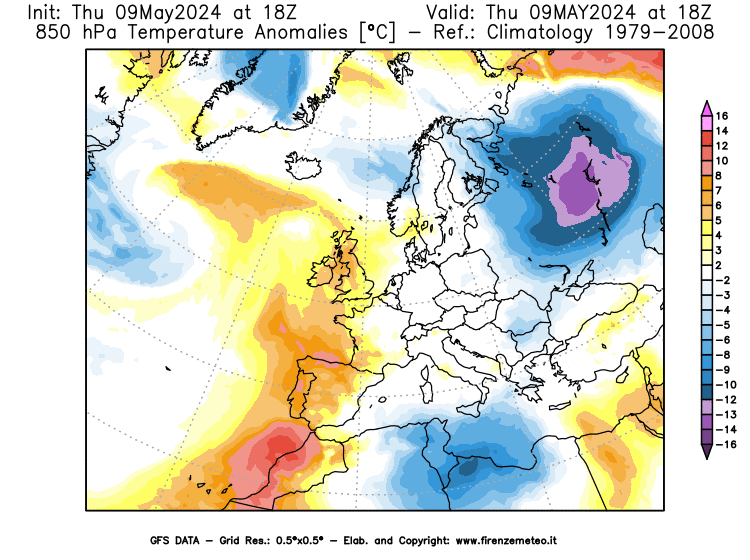
Above-average temperatures are associated with PNA+ in Canada and the western United States,
while below-average temperatures are associated with the eastern United States, and vice versa in the
case of PNA-. With PNA+ it is possible to observe descents of Arctic air towards central-southern Europe,
with a meridian trajectory.
The following figure shows the loading patterns for January, April, July, and October, so that the
plotted value at each grid point represents the temporal correlation between the monthly standardized
height anomalies at that point and the teleconnection pattern time series valid for the specified month.
Credits: cpc.ncep.noaa.gov
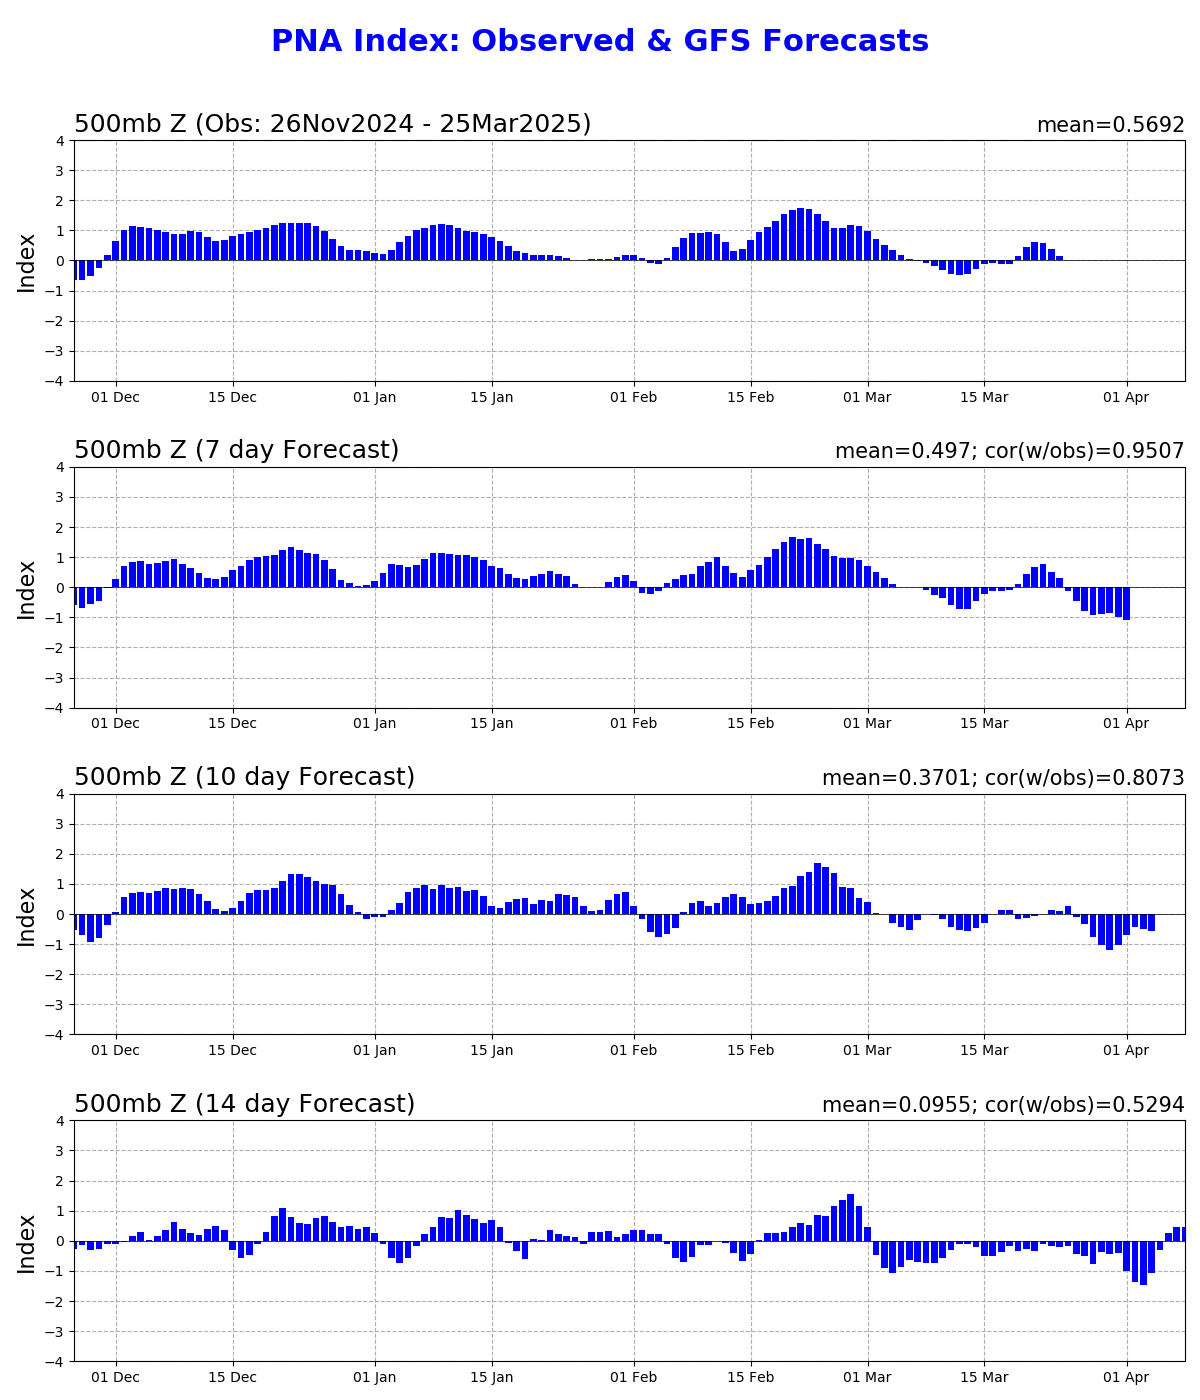
PNA index: observed and GFES forecasts
The daily PNA indices are shown for the previous 120 days, and the GFS forecasts of the daily PNA index at
selected lead times are appended onto the time series. The indices are standardized by
standard deviation of the observed monthly PNA index from 1950-2000 interpolated to the day in question.
A 3-day running mean is applied to the forecast time series.
The values at the upper left and right corner of each figure indicate the mean value of
the PNA index and the correlation coefficients between the observation and the forecasts, respectively.
Credits: cpc.ncep.noaa.gov
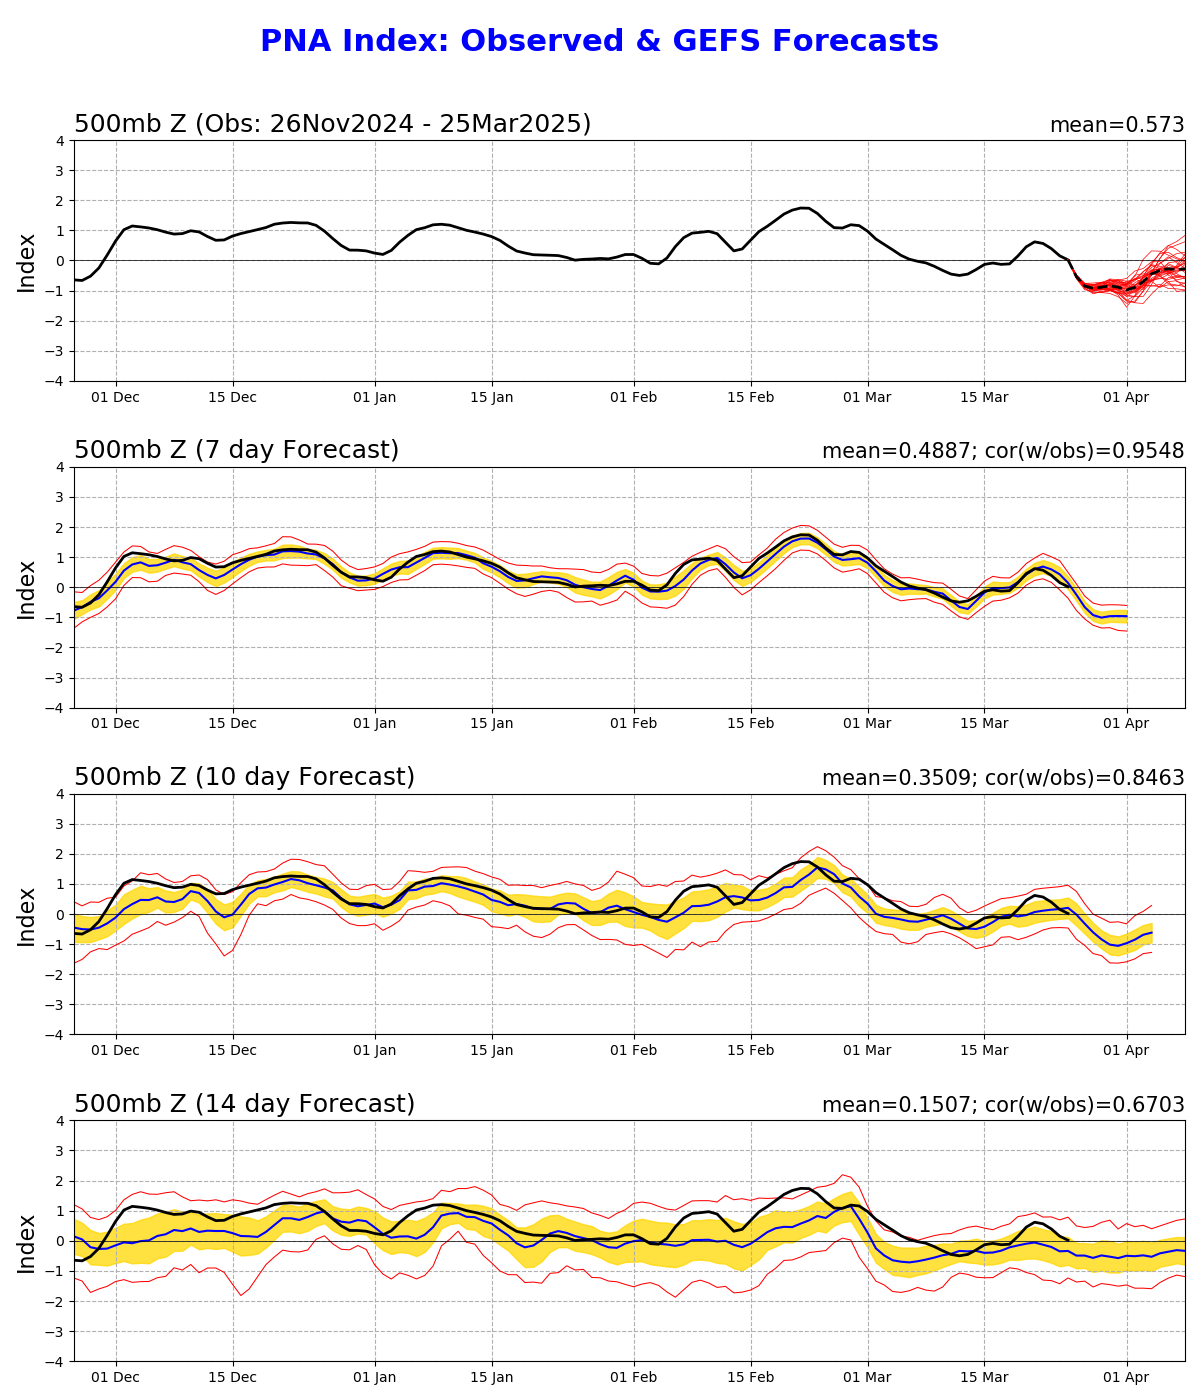
PNA index: observed and GFES forecasts
The daily PNA indices are shown for the previous 120 days, and the ensemble forecasts of
the daily PNA index at selected lead times are appended onto the time series. The indices are
standardized by standard deviation of the observed monthly PNA index from 1950-2000 interpolated
to the day in question. A 3-day running mean is applied to the forecast time series.
The values at the upper left and right corners of each figure indicate the mean value of
the PNA index and the correlation coefficients between the observations and the forecasts, respectively.
The first panel shows the observed PNA index (black line) plus forecasted PNA indices from each
of the 11 MRF ensemble members starting from the last day of the observations (red lines).
The ensemble mean forecasts of the PNA index are obtained by averaging the 11 MRF ensemble
members (blue lines), and the observed PNA index (black line) is superimposed on each
panel for comparison. For the forecasted indices (lower 3 panels), the yellow shading shows the
ensemble mean plus and minus one standard deviation among the ensemble members, while the upper
and lower red lines show the range of the forecasted indices, respectively.
Credits: cpc.ncep.noaa.gov
Monthly average AO index since January 1950
In the following table all the monthly average values of PNA index from 1950 to today.
With a red scale, values higher than +0.5 are highlighted, with a blue scale those lower than -0.5.
Below the table, a diagram again shows the PNA values recorded.
| JAN | FEB | MAR | APR | MAY | JUN | JUL | AUG | SEP | OCT | NOV | DEC | |
|---|---|---|---|---|---|---|---|---|---|---|---|---|
| 1950 | -2.340 | -1.040 | +0.240 | +0.010 | -0.550 | -1.970 | -0.430 | +0.820 | -1.150 | +0.490 | -1.810 | +0.020 |
| 1951 | -0.410 | -1.360 | -0.810 | +0.730 | +1.260 | -0.610 | -0.020 | +0.050 | -0.050 | +0.240 | +0.230 | -1.290 |
| 1952 | -1.980 | +0.280 | -0.400 | +1.160 | -0.990 | +0.390 | -1.230 | +0.800 | +0.530 | +0.800 | +0.820 | +0.930 |
| 1953 | +0.650 | +1.000 | -0.150 | +1.050 | +1.200 | -1.600 | +0.740 | -1.120 | -0.120 | +1.910 | +1.650 | +1.270 |
| 1954 | -1.140 | -0.140 | -1.170 | -2.700 | +0.640 | -0.020 | +0.300 | -0.080 | +0.000 | +0.750 | +1.450 | -0.520 |
| 1955 | +0.400 | -1.740 | -2.230 | +0.000 | -0.570 | +0.000 | -0.960 | -0.520 | -0.210 | +0.310 | -0.960 | -2.070 |
| 1956 | -1.320 | -1.040 | -0.690 | +0.070 | -0.290 | -0.180 | -0.920 | -0.200 | +0.550 | -2.110 | +1.060 | -0.310 |
| 1957 | -1.190 | -1.190 | +1.100 | -0.170 | +1.310 | +0.120 | +0.330 | -0.960 | -0.220 | +0.270 | +0.520 | -0.430 |
| 1958 | +0.990 | +0.490 | +0.490 | +0.570 | +0.650 | +1.290 | +1.240 | +2.150 | -0.010 | +0.160 | +0.090 | +0.650 |
| 1959 | -0.690 | -0.700 | +0.520 | -0.680 | -0.440 | +0.910 | -0.030 | +1.060 | +1.480 | +0.060 | +0.280 | +0.660 |
| 1960 | +0.380 | +0.060 | -0.400 | +0.180 | +1.030 | +1.020 | +1.640 | +1.880 | +0.040 | +0.290 | -0.530 | +1.460 |
| 1961 | +1.410 | +0.350 | +0.590 | -0.920 | -0.380 | +1.620 | -0.110 | +0.500 | +1.370 | -1.910 | -0.410 | -1.240 |
| 1962 | -0.070 | -0.180 | -0.430 | -1.300 | -1.360 | -1.010 | +0.060 | +0.600 | -0.950 | +1.060 | +0.570 | -0.080 |
| 1963 | +0.580 | +0.810 | -1.790 | -0.560 | -1.170 | +0.370 | -0.730 | -0.980 | +1.100 | +0.690 | -0.310 | +1.770 |
| 1964 | +0.160 | +1.240 | -1.040 | -1.090 | -2.680 | +0.150 | +0.660 | +0.860 | +1.150 | +0.580 | -0.810 | -1.730 |
| 1965 | -0.210 | -0.550 | -0.520 | -0.850 | -0.570 | +1.670 | -0.900 | +0.350 | +0.480 | +1.140 | -0.840 | -1.260 |
| 1966 | +0.390 | -1.310 | +0.740 | -0.310 | -0.270 | -0.010 | -0.810 | +1.290 | +0.810 | -0.700 | -2.040 | +0.090 |
| 1967 | -0.400 | +0.070 | -2.000 | -1.720 | -1.010 | -0.410 | -0.880 | -0.320 | +0.180 | +0.850 | -0.360 | -0.820 |
| 1968 | -0.880 | +1.050 | +0.440 | -0.890 | +0.170 | -0.180 | +0.410 | +1.330 | -0.990 | +0.260 | +0.880 | -1.440 |
| 1969 | -1.800 | -1.250 | +0.780 | +0.740 | +1.060 | +1.880 | +0.990 | -0.660 | +1.620 | +0.350 | +0.150 | +1.840 |
| 1970 | +0.600 | +0.980 | +0.810 | -0.430 | -0.660 | +0.110 | +1.240 | -0.570 | -0.420 | -1.010 | -1.190 | -0.790 |
| 1971 | -1.390 | +0.100 | +0.020 | +0.480 | +1.140 | +0.380 | -1.410 | -0.780 | +0.230 | -1.370 | -0.260 | -1.460 |
| 1972 | -1.410 | -1.480 | +0.200 | -1.760 | +0.140 | -0.240 | -0.760 | -0.010 | +0.210 | -1.500 | +0.560 | -0.560 |
| 1973 | -0.180 | +0.120 | +0.850 | +0.360 | +0.660 | +0.840 | +0.170 | -0.920 | -0.280 | -0.820 | -1.730 | +0.530 |
| 1974 | -0.690 | -0.900 | -0.820 | -0.500 | -0.550 | -1.380 | +0.350 | +0.930 | +0.470 | +0.690 | +0.570 | +0.680 |
| 1975 | -0.430 | -0.160 | -0.530 | -0.440 | +0.590 | -0.390 | -1.190 | -1.070 | -0.230 | -0.740 | -0.650 | +0.140 |
| 1976 | +0.310 | -1.560 | -1.520 | +1.190 | +0.560 | -1.340 | +0.320 | -0.590 | +0.000 | +0.680 | +1.810 | +0.510 |
| 1977 | +1.750 | +2.040 | -0.400 | -0.080 | -0.730 | +0.430 | -0.670 | +2.220 | -0.820 | +0.980 | -0.220 | -0.500 |
| 1978 | +0.610 | +1.270 | +0.120 | +0.050 | -0.920 | -0.970 | -2.150 | +0.050 | +1.710 | +0.480 | -0.490 | -0.720 |
| 1979 | -0.690 | -1.820 | +0.380 | +0.090 | +1.350 | -1.640 | +0.990 | +0.700 | +1.280 | +1.530 | +0.540 | -0.380 |
| 1980 | -0.280 | +1.740 | -0.350 | +1.960 | -0.280 | -0.860 | -0.420 | -1.990 | -0.050 | +2.450 | +1.350 | -0.270 |
| 1981 | +2.420 | +0.380 | +1.600 | -1.020 | +1.980 | -0.200 | -0.640 | -1.500 | +0.150 | -1.450 | +1.260 | -0.120 |
| 1982 | -0.860 | -0.680 | -1.400 | -1.890 | -0.700 | +1.930 | +0.970 | +0.340 | +1.050 | -0.930 | -0.480 | +0.750 |
| 1983 | +1.180 | +1.300 | +2.380 | +1.260 | -0.190 | +1.870 | +1.330 | +0.530 | -1.590 | +0.090 | +1.840 | -0.310 |
| 1984 | +0.970 | +0.770 | +1.410 | +1.700 | +0.320 | -0.440 | -2.340 | -1.110 | +0.030 | -0.630 | +0.420 | -1.600 |
| 1985 | +1.630 | -0.520 | -0.920 | -1.060 | -1.030 | +1.100 | +0.250 | -0.500 | -0.710 | -1.510 | -1.900 | +1.390 |
| 1986 | +0.970 | +0.530 | +0.830 | +0.090 | -0.130 | +0.260 | +0.070 | -1.450 | -0.290 | +0.920 | -0.730 | +1.370 |
| 1987 | +1.000 | +0.650 | +1.170 | +1.830 | -1.260 | +0.420 | -0.010 | +0.770 | -3.070 | +0.530 | +1.260 | +0.800 |
| 1988 | +0.530 | +1.250 | +0.690 | +1.400 | +0.600 | +1.130 | +2.160 | -0.590 | -1.110 | +0.660 | +0.130 | +0.630 |
| 1989 | -0.720 | -1.060 | -1.300 | -0.540 | -0.140 | -0.630 | -0.180 | -0.240 | +0.540 | -1.130 | -0.720 | +0.870 |
| 1990 | -0.340 | -1.860 | +0.340 | -0.390 | +0.210 | -1.410 | +0.170 | +1.790 | -0.500 | -0.970 | -1.730 | -1.320 |
| 1991 | +0.660 | +1.070 | -0.940 | +0.640 | -0.810 | -0.970 | +0.750 | -0.250 | +1.430 | -2.280 | +0.240 | +0.470 |
| 1992 | +1.280 | +0.290 | +0.770 | -0.050 | +1.270 | +1.170 | +0.850 | -0.340 | -1.310 | +0.210 | +0.850 | -1.230 |
| 1993 | -0.650 | +0.550 | +1.270 | +1.540 | +2.660 | +0.520 | +0.150 | -0.140 | -1.120 | -0.300 | -0.360 | +0.720 |
| 1994 | -0.120 | -0.730 | +0.540 | -0.470 | +0.450 | -1.380 | +0.380 | -1.340 | -2.380 | -0.230 | -1.670 | +0.690 |
| 1995 | +0.660 | +0.730 | +0.330 | +0.290 | +0.010 | +0.740 | -0.340 | -0.300 | +1.520 | -0.050 | -0.750 | +0.920 |
| 1996 | -0.020 | -0.300 | -0.470 | +0.770 | +0.320 | -1.210 | +0.640 | -0.900 | -0.280 | -0.760 | -0.450 | -1.230 |
| 1997 | +0.630 | +0.560 | -1.300 | +0.550 | +0.780 | -0.340 | +0.560 | -0.520 | +0.310 | -0.260 | +0.910 | +1.160 |
| 1998 | +0.740 | +0.890 | +1.010 | +1.120 | -2.220 | -0.020 | +2.240 | -0.570 | +0.550 | +0.550 | +0.740 | -0.090 |
| 1999 | +0.160 | -0.120 | +0.690 | +0.300 | -0.150 | +0.300 | -0.540 | +1.970 | +0.440 | +0.410 | +0.480 | +0.210 |
| 2000 | -0.820 | +1.120 | +1.280 | -0.350 | -0.280 | -1.220 | -2.280 | -0.480 | -1.400 | +0.250 | +0.740 | +1.230 |
| 2001 | +1.510 | -0.160 | +0.700 | -0.470 | -0.110 | -0.940 | +0.060 | -0.110 | +0.100 | -0.220 | +1.090 | +0.560 |
| 2002 | -0.040 | +0.140 | -1.300 | -2.220 | -0.730 | -0.050 | +0.880 | +0.640 | +0.770 | -0.650 | +1.540 | +1.590 |
| 2003 | +1.290 | +0.730 | -0.070 | +0.140 | -2.200 | -0.600 | +1.230 | -0.280 | +0.760 | +0.970 | -1.720 | +0.860 |
| 2004 | +0.410 | +1.060 | +0.300 | +0.510 | -1.760 | -0.370 | +0.090 | +1.550 | -0.080 | -1.390 | +0.310 | +0.260 |
| 2005 | +0.020 | +0.140 | +0.880 | +1.280 | +1.740 | +0.290 | +0.430 | +0.720 | +1.630 | +0.900 | -0.760 | +1.380 |
| 2006 | +0.434 | -0.112 | -0.274 | +0.446 | -1.271 | -1.063 | +1.834 | -1.407 | +0.424 | -0.838 | -1.389 | +1.865 |
| 2007 | +0.717 | -0.087 | +0.181 | +1.245 | -0.057 | -0.379 | +2.209 | +1.978 | +1.883 | +0.550 | +0.693 | +0.140 |
| 2008 | -0.318 | +0.501 | -0.323 | -0.971 | +1.327 | -1.753 | -0.099 | +0.921 | +1.117 | +0.856 | +1.110 | -1.410 |
| 2009 | +0.606 | -0.948 | -1.024 | +0.211 | -0.581 | +0.350 | +1.218 | +0.650 | +1.289 | +0.431 | +0.206 | +0.339 |
| 2010 | +1.254 | +0.579 | +2.020 | +1.536 | -0.932 | -0.204 | +1.395 | +1.102 | +1.336 | +1.797 | -0.845 | -1.777 |
| 2011 | +1.286 | -1.581 | +0.689 | -1.586 | +0.190 | +0.224 | -0.355 | +1.422 | -0.420 | +0.627 | -0.789 | +0.363 |
| 2012 | +0.604 | +0.750 | +0.107 | +0.154 | -0.423 | -0.501 | -0.163 | -0.171 | -0.422 | -1.176 | -1.095 | -1.010 |
| 2013 | +0.546 | +0.448 | +0.038 | -1.557 | -0.364 | -0.435 | -0.307 | -0.029 | +0.544 | -0.341 | -1.183 | -0.858 |
| 2014 | +0.968 | -0.951 | -0.208 | +0.246 | -0.763 | -1.458 | +0.987 | +1.370 | +0.989 | +0.887 | +0.678 | +0.669 |
| 2015 | +0.612 | +0.590 | -0.230 | -0.150 | -0.158 | -0.173 | +0.761 | +0.079 | -0.918 | +1.775 | -0.193 | +0.777 |
| 2016 | +2.021 | +1.482 | +0.728 | +0.866 | -1.061 | -0.701 | +1.019 | -0.876 | +0.182 | +1.239 | +1.517 | -0.353 |
| 2017 | +0.280 | +0.185 | +0.268 | +0.397 | -0.311 | +1.005 | +1.864 | +0.232 | -0.331 | -0.398 | -2.057 | +0.888 |
| 2018 | +0.400 | -1.026 | -0.886 | -0.909 | -1.336 | +0.511 | -0.367 | +1.267 | +1.437 | +0.210 | +0.241 | +0.860 |
| 2019 | +0.834 | -1.076 | +0.250 | -0.612 | -0.291 | +0.121 | +1.112 | +1.179 | +2.000 | -1.024 | -0.057 | +0.181 |
| 2020 | -0.237 | +0.172 | -2.171 | -1.176 | +0.211 | +0.704 | +1.728 | +1.822 | +0.754 | -1.131 | +0.235 | +1.584 |
| 2021 | +0.186 | -0.307 | -0.969 | -1.049 | -1.347 | +0.666 | +0.562 | +0.955 | +0.443 | +1.134 | +0.722 | -2.558 |
| 2022 | +1.009 | +0.658 | +0.135 | -0.735 | -0.826 | -0.313 | +2.540 | +0.789 | +0.209 | +0.166 | -0.734 | -0.662 |
| 2023 | +0.215 | -0.640 | -1.634 | -0.424 | -0.858 | +0.687 | +1.145 | +0.447 | +1.058 | +1.204 | +0.546 | +1.214 |
| 2024 | +0.446 | +0.088 | +0.451 | -0.653 |
Standardized 3-Month Running Mean PNA Index
Credits: cpc.ncep.noaa.gov