Southern Oscillation Index [SOI index]


  Teleconnections and long range forecasts  
AAO (Antarctic Oscillation) NAM (North Annular Mode) SCAND (Scandinavia pattern) Stratosphere Analysis
AO (Arctic Oscillation) NAO (North Atlantic Oscillation) SOI (Southern Oscillation) North-Pole Stratosphere Temp
EA (East Atlantic) Polar/Eurasia SST (Sea Surface Temperature) 10 hPa Temp&Geop
EA/WR (East Atl./Western Russia) PNA (Pacific North-America) 100 hPa Temp&Geop
MJO (Madden Julian Oscillation) QBO (Quasi-Biennial Oscillation) Intraseasonal Oscillations


Teleconnective indices: Southern Oscillation Index [SOI index]

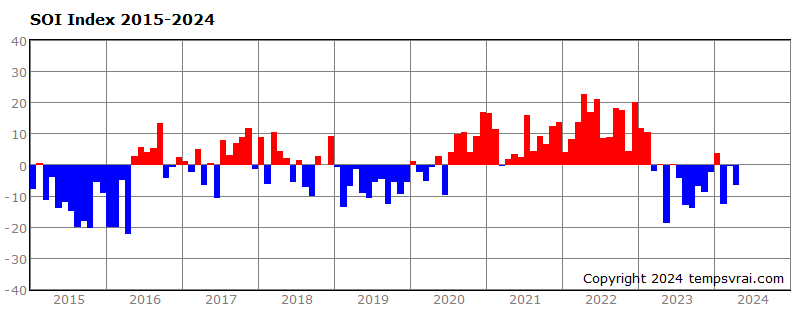
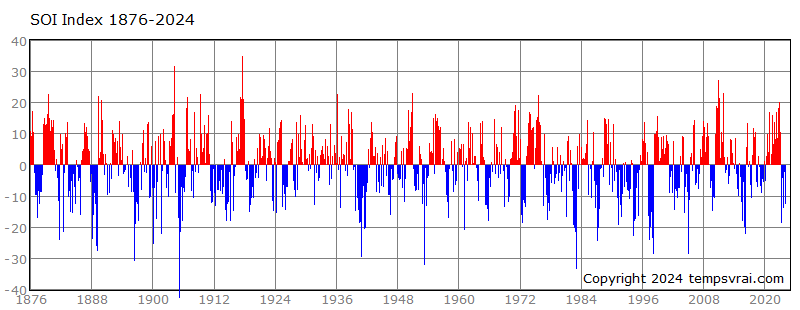
The Southern Oscillation Index (SOI) is an index that is based on the difference in air pressure between Darwin (Australia) and Tahiti. The SOI is closely related to the El Niño/La Niña climate phenomenon.
A consistently negative Southern Oscillation (SOI-) often indicates the presence of an El Niño. An El Nino is defined as a prolonged warming of the eastern tropical Pacific Ocean, which leads to a weakening or even a reversal in the trade winds across the Pacific Ocean. Subsequently, this tends to reduce rainfall in eastern and northern Australia. Major El Nino events in the past have included 1997/98 and 1982/83.
A consistently positive Southern Oscillation (SOI+) often indicates the presence of a La Niña. A La Nina occurs when sea surface temperatures to the north of Australia are warmer than normal and trade winds across the Pacific Ocean strengthen. This is the opposite of an El Nino, and subsequently, the results are also opposite. Rainfall probabilities across eastern and northern Australia are higher than normal. Recent strong La Nina events have included 1998/99 and 1988/89.

Southern Oscillation Index, SOI: values of the last 10 years
The diagram shows the current situation of the Southern Oscillation Index and the values of the last 10 years. This so-called SOI index is calculated from the difference between the air pressure values of the central Pacific island of Tahiti and the northern Australian city of Darwin. SOI values greater than 8 correspond to episodes of La Niña, while values lower than -8 to episodes of El Niño
Credits: chaac.meteo.plus
Southern Oscillation Index, SOI: values since 1876
The diagram shows the Southern Oscillation Index values since 1876.
Credits: chaac.meteo.plus
Southern Oscillation Index, SOI: 30-day mean
The diagram shows the 30-day mean of Southern Oscillation Index.
Credits: chaac.meteo.plus

Suggested sections

Webcams of the Alps

All the webcams of the Alps in a handy interactive map! Select the region, the province and select the location.

Webcam map of the Apennines

Consult the webcams installed along the Apennines using our interactive map to find the place of your interest!

GFS weather maps

Weather forecast issued by the GFS model (Global Forecast System) of the National Centers for Environmental Prediction (NCEP).

Earthquakes in real time in Italy

Maps and table with the latest earthquakes detected by the INGV monitoring system.