Sea Surface Temperature [SST]
SST (Sea Surface Temperature) and SSTA (Sea Surface Temperature Anomalies)
Maps with sea surface temperature and anomalies.
Credits: esrl.noaa.gov
SSTA (Sea Surface Temperature Anomalies)

Credits: ospo.noaa.gov
SSTA (Sea Surface Temperature Anomalies)

Credits: esrl.noaa.gov
SSTA (Sea Surface Temperature Anomalies), Mediterranean Sea
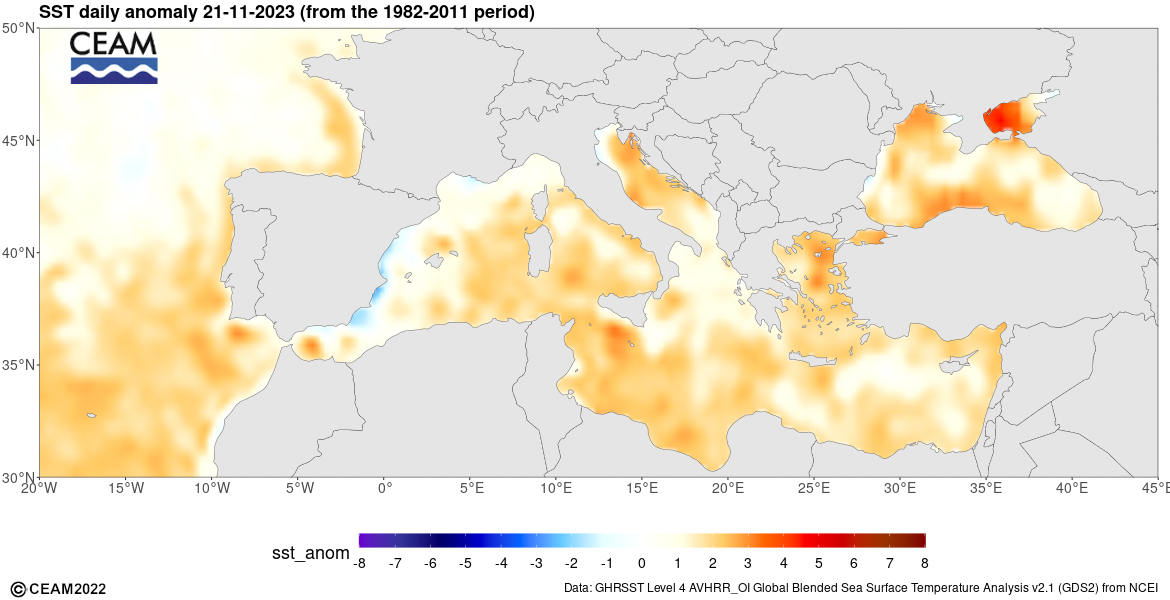
Credits: ospo.noaa.gov
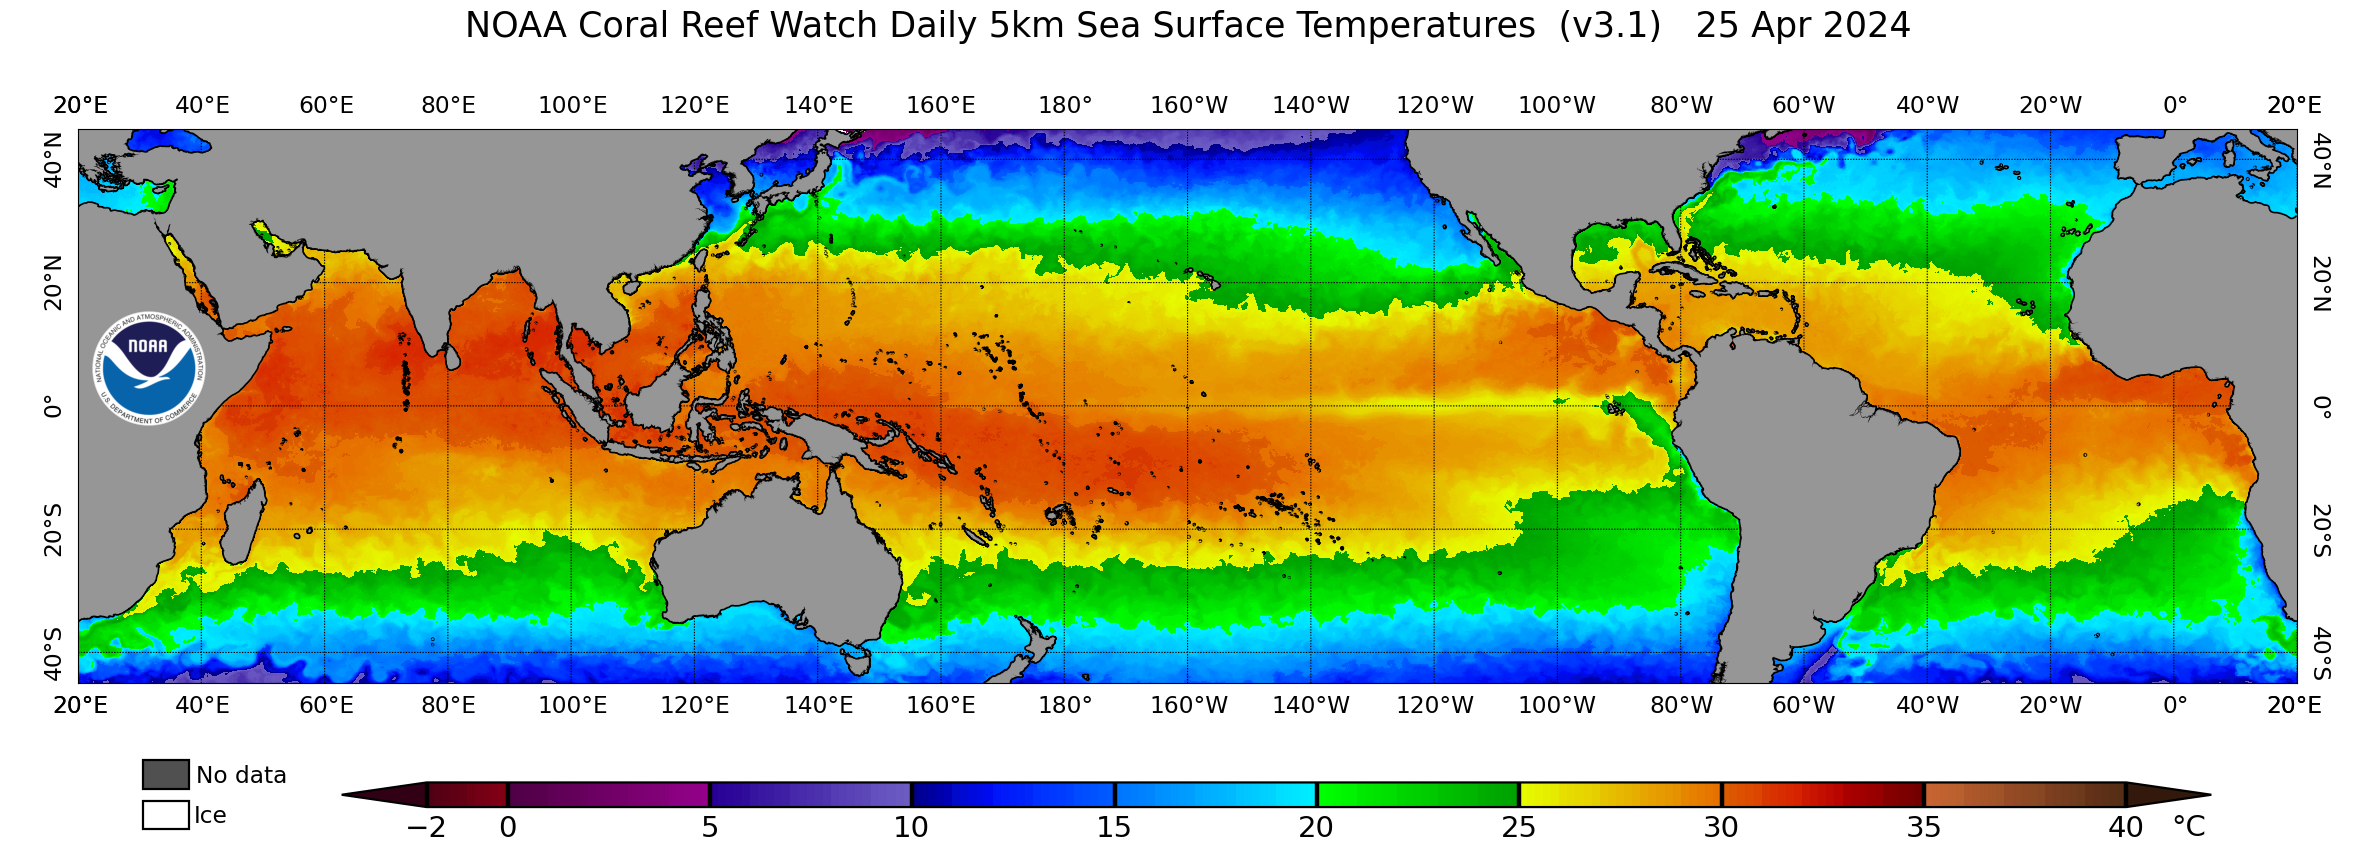
SST - World

Credits: coralreefwatch.noaa.gov
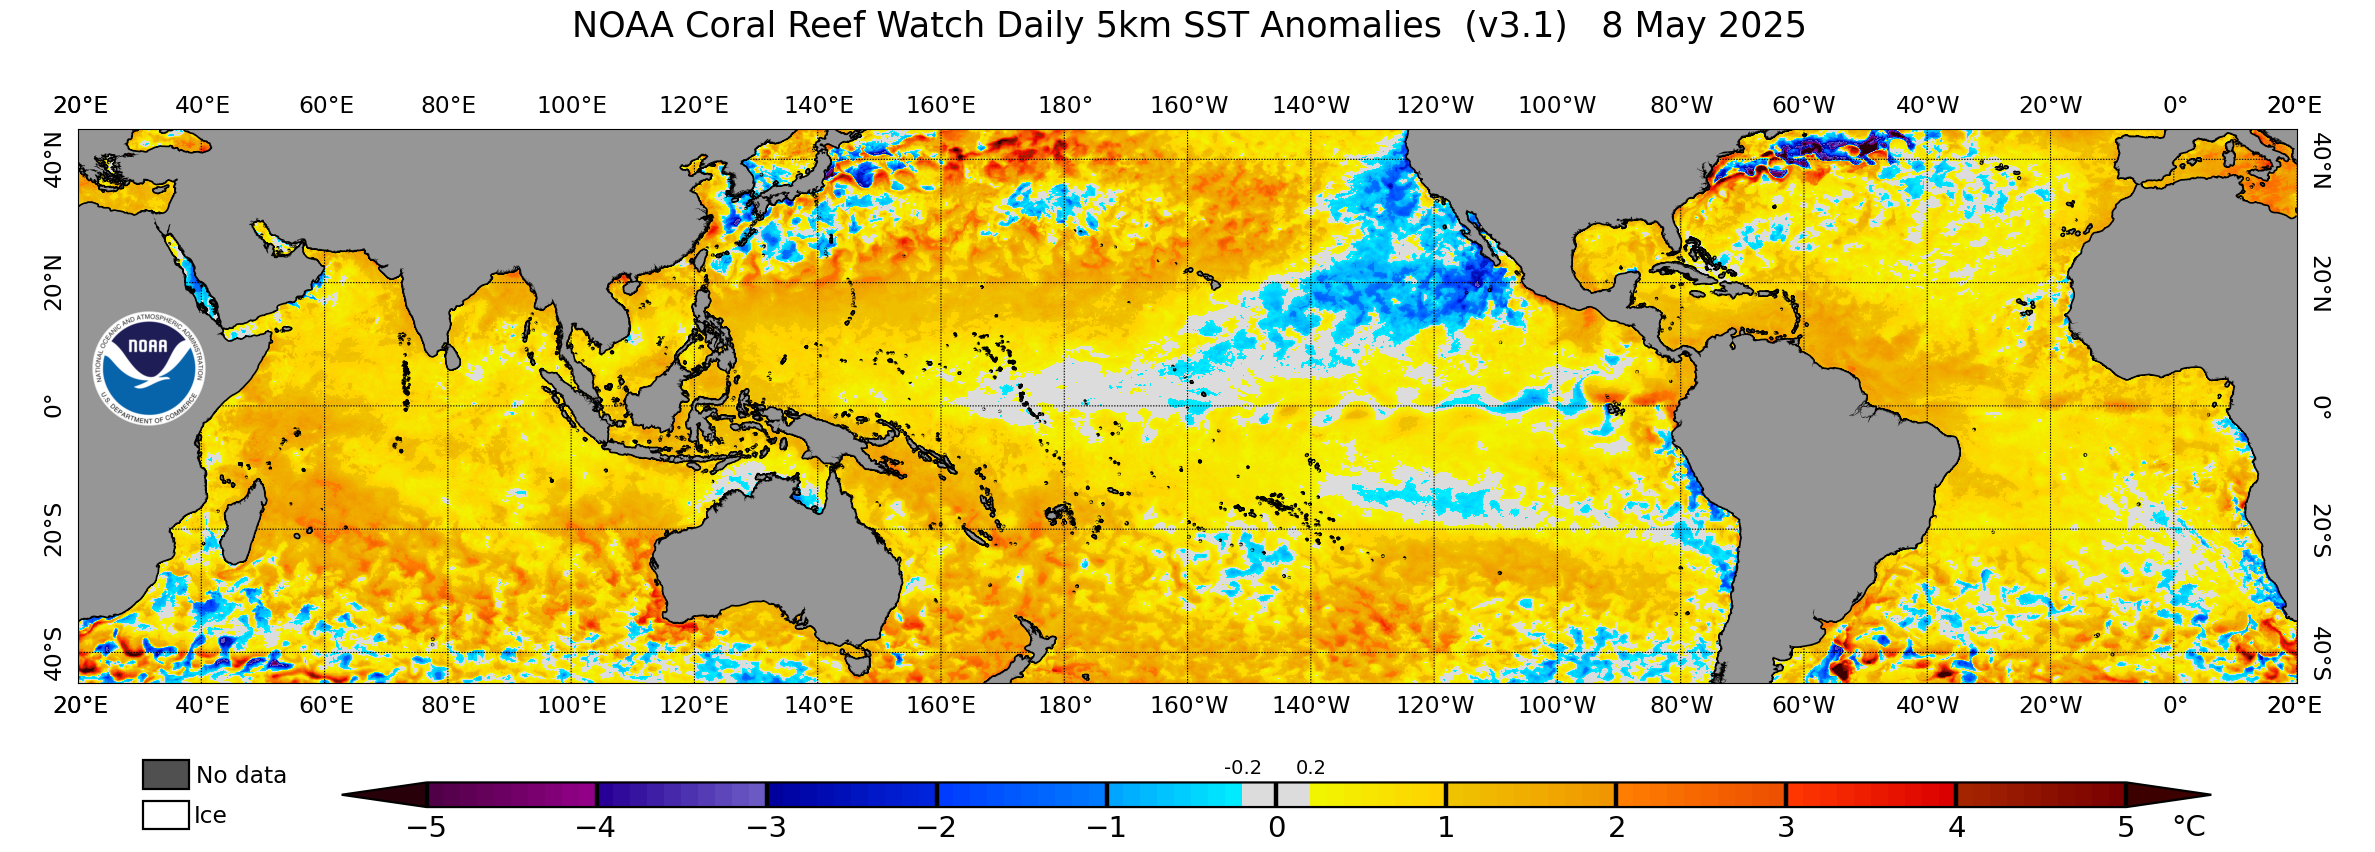
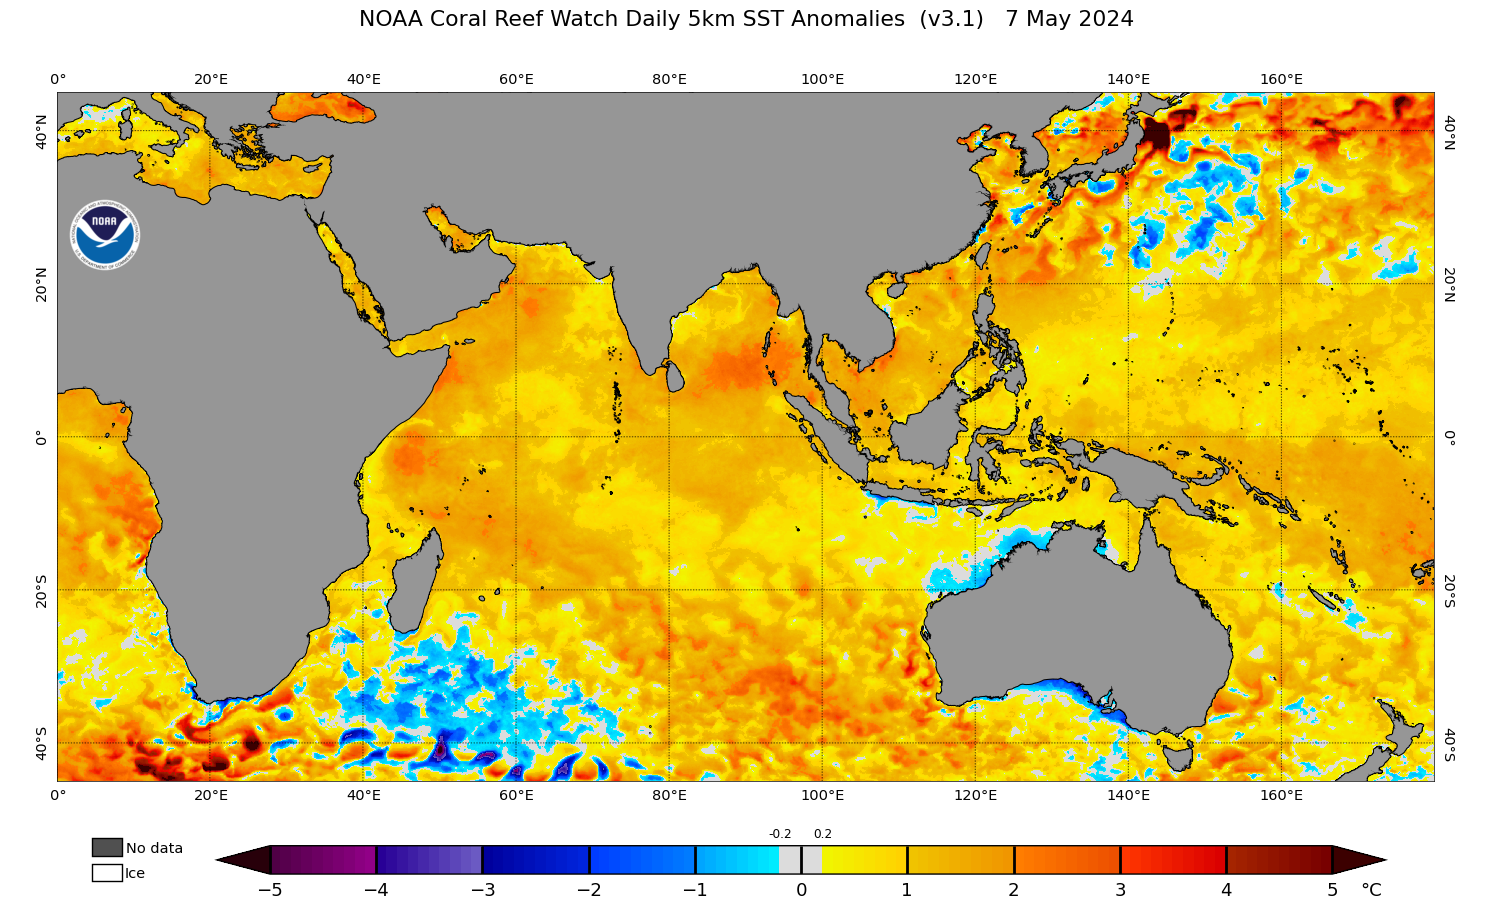
SSTA - World
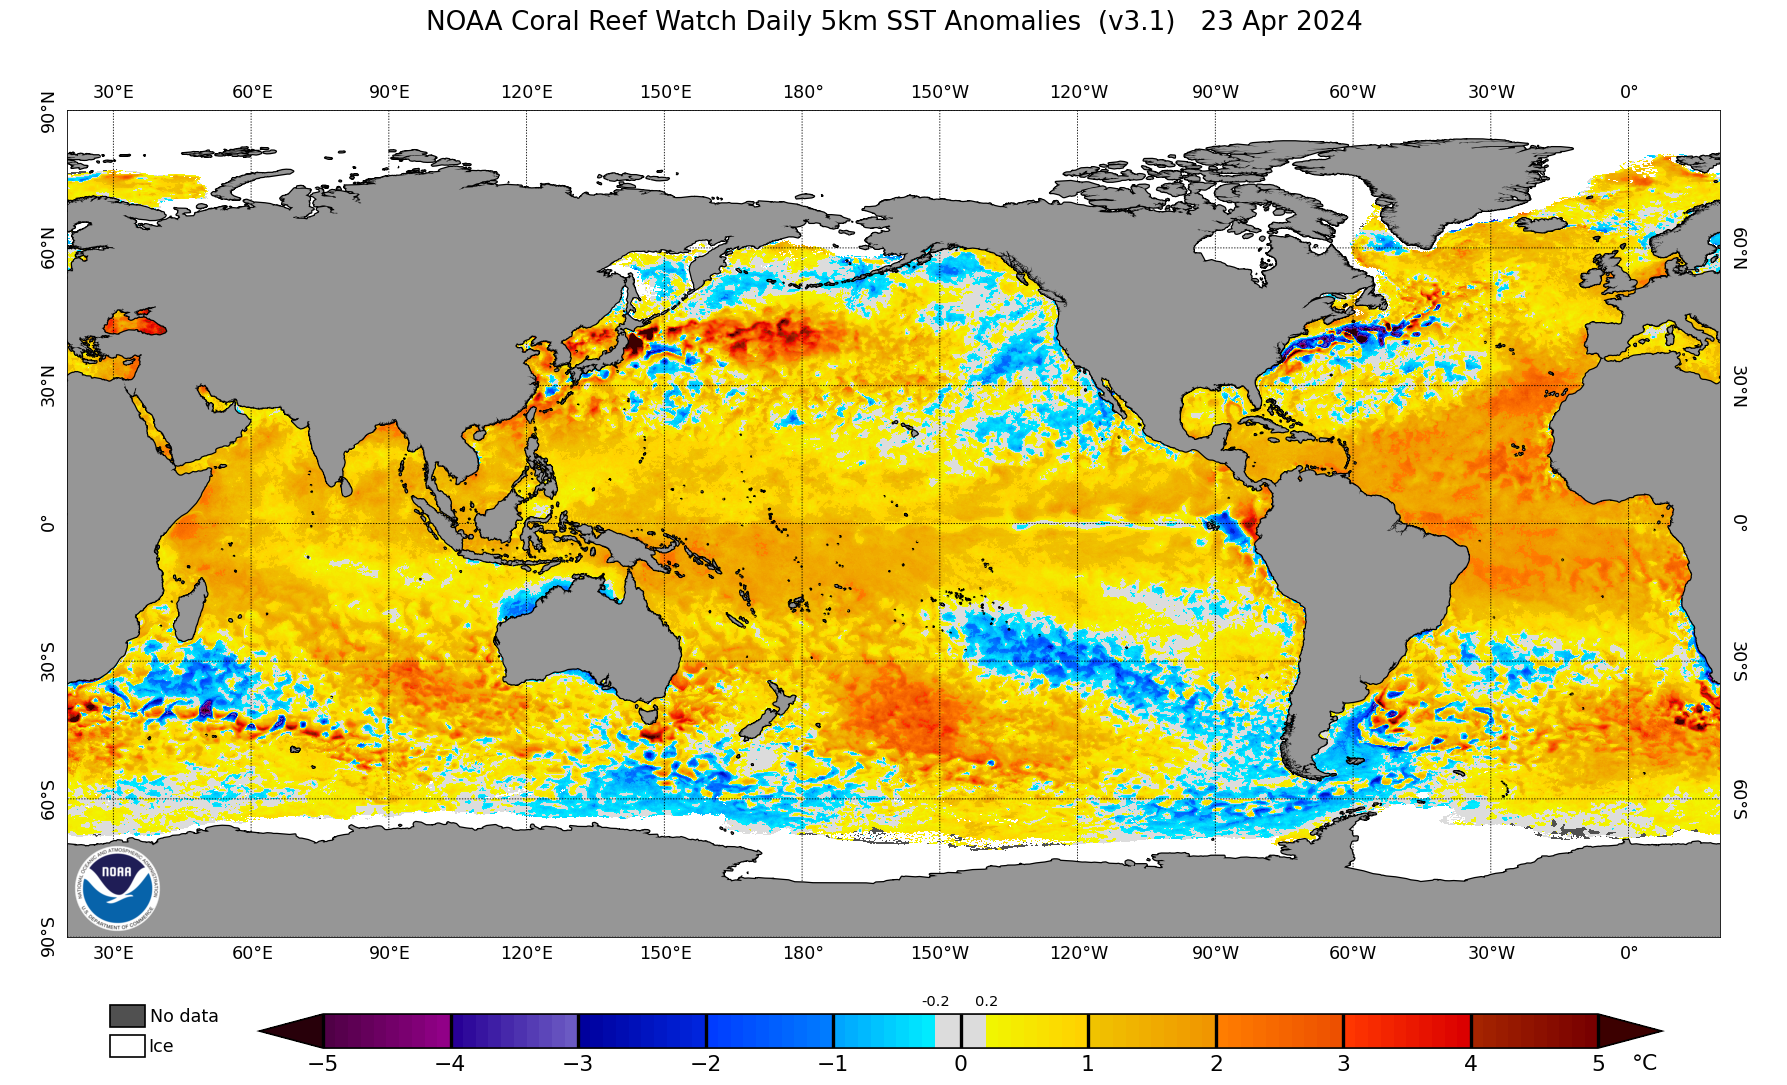
Credits: coralreefwatch.noaa.gov
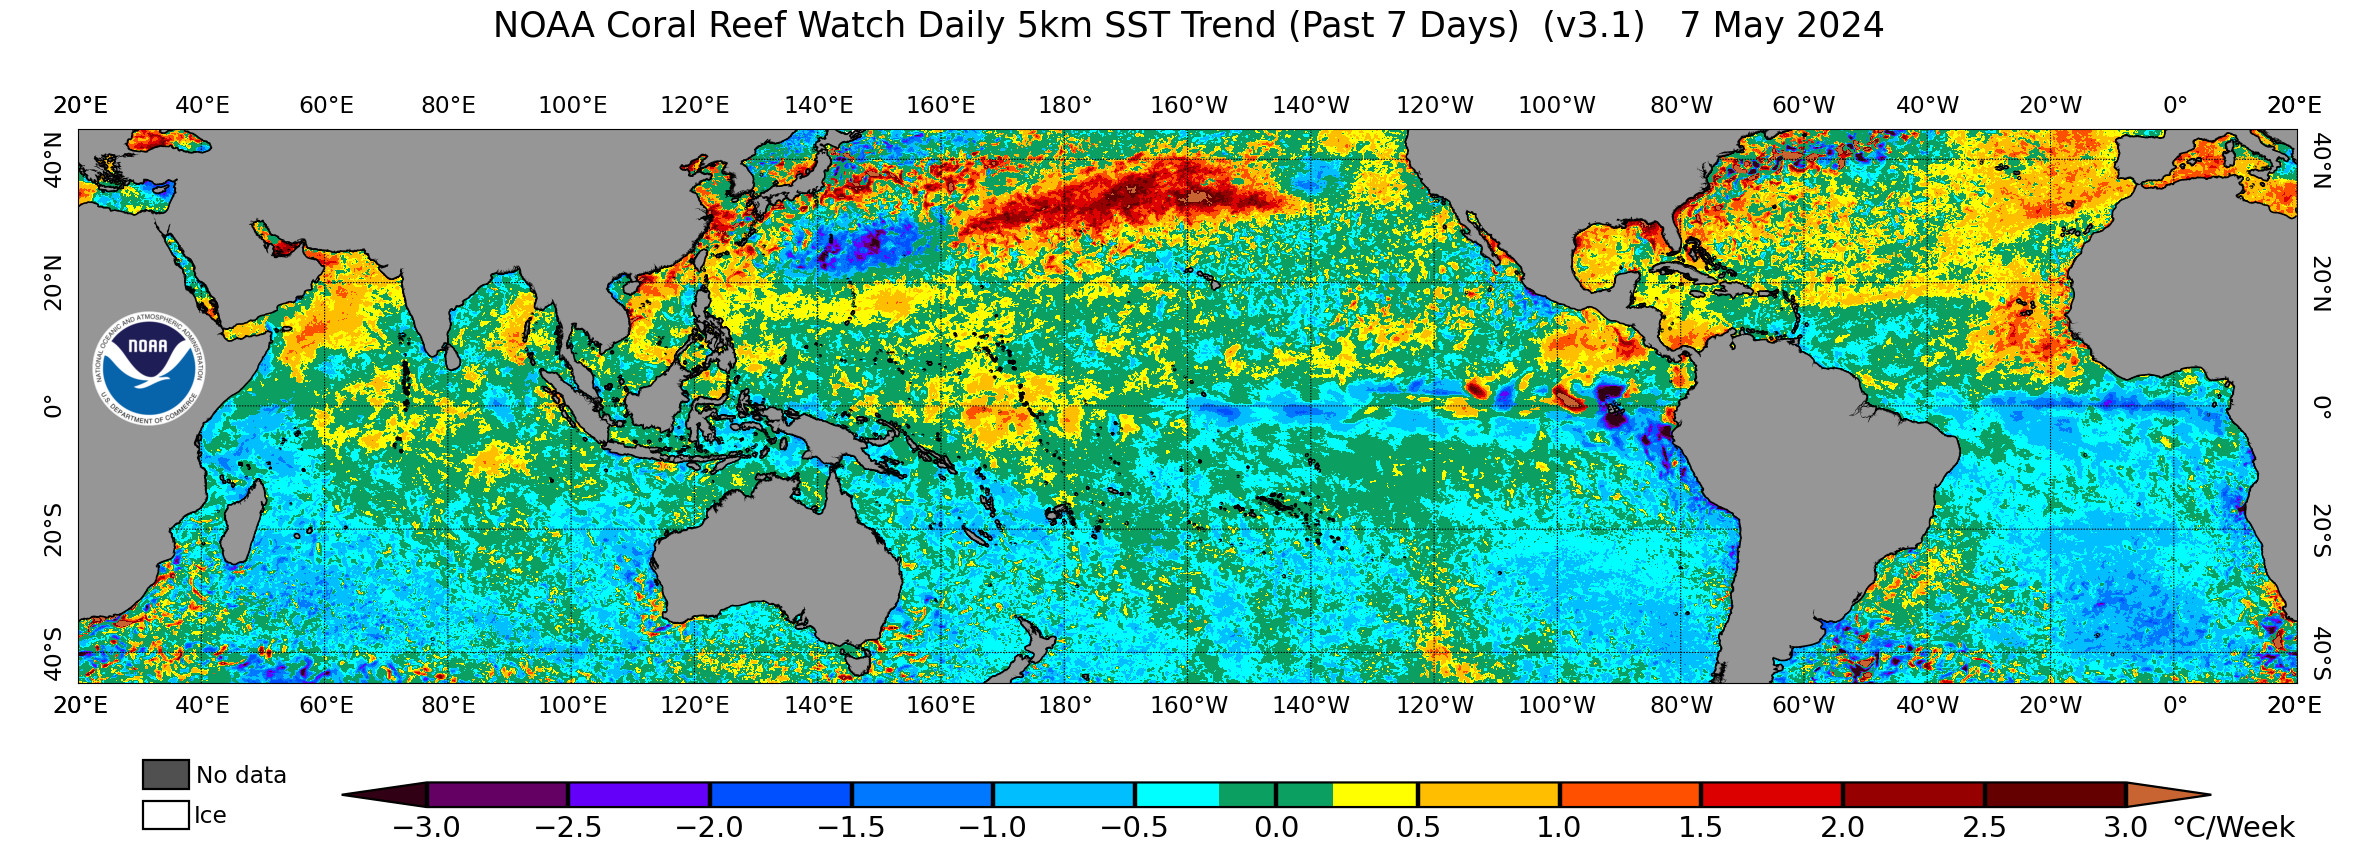
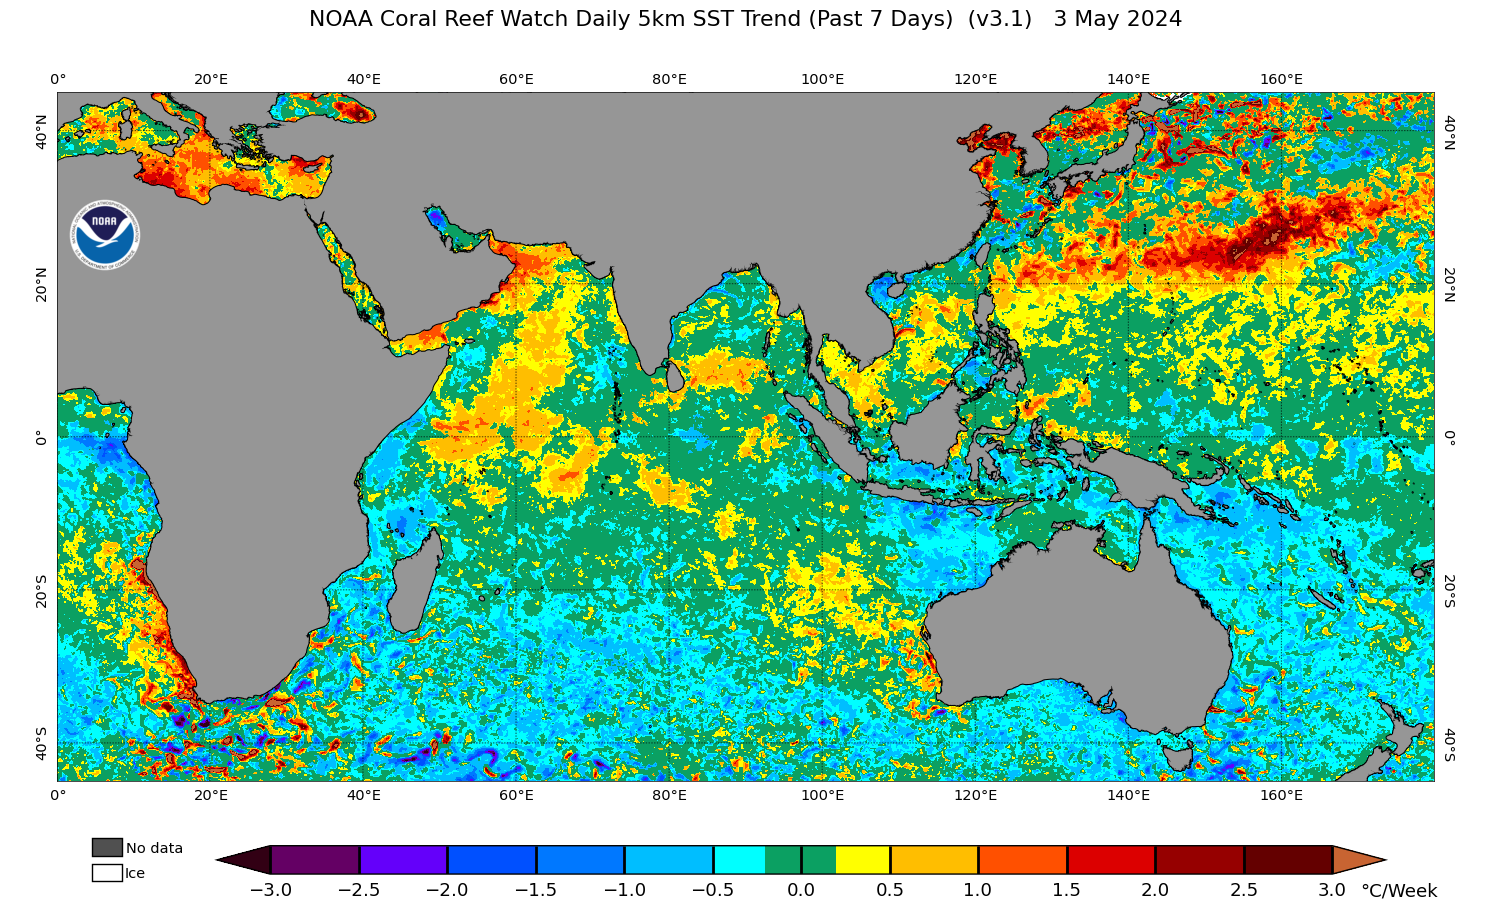
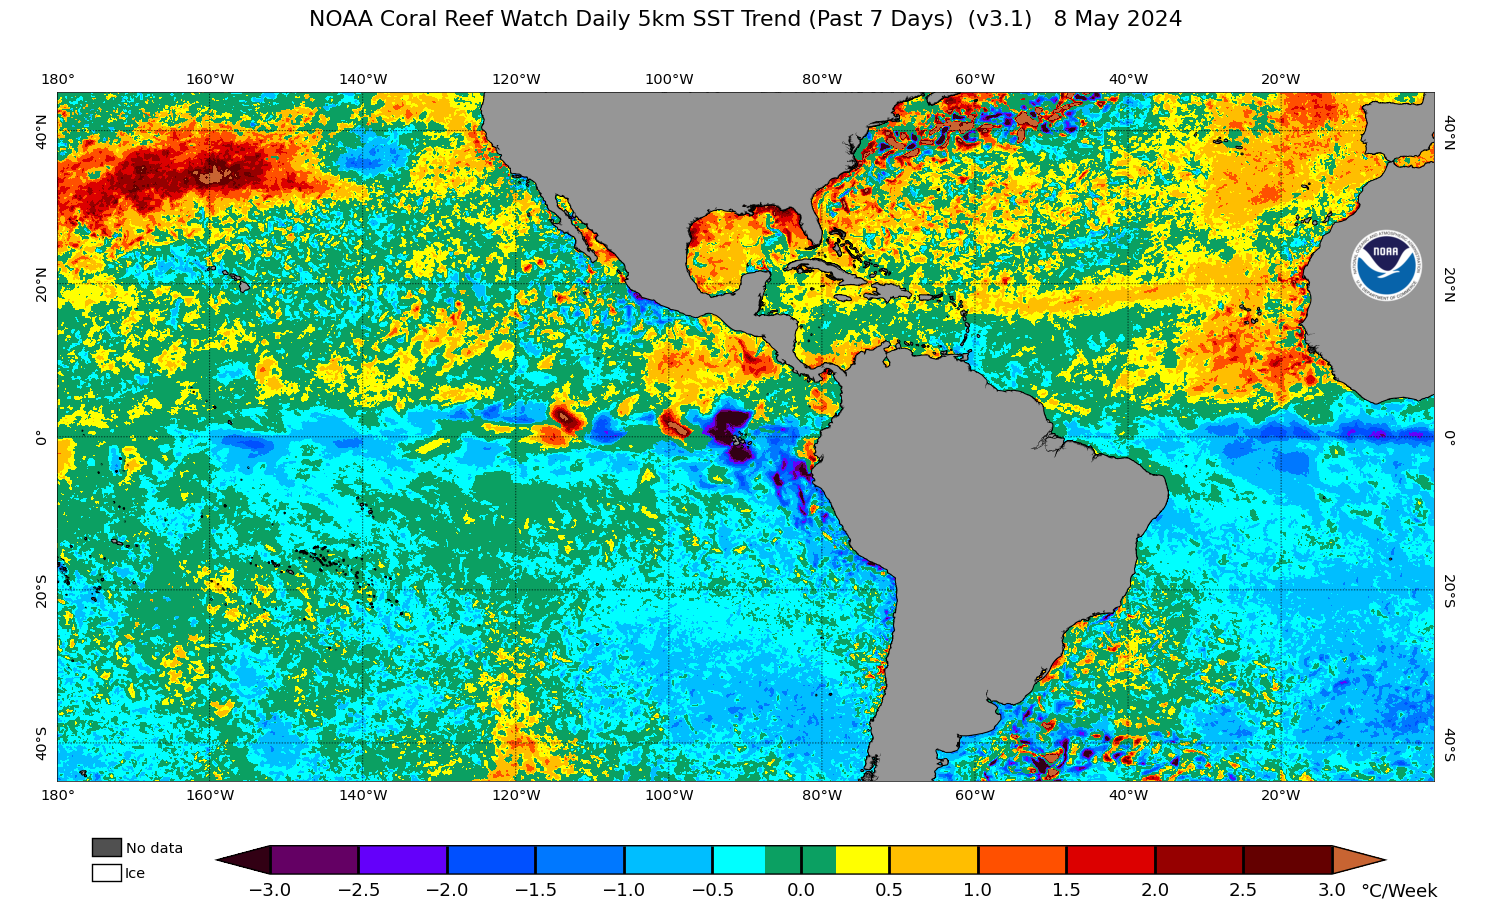
SST Trend - World

Credits: coralreefwatch.noaa.gov
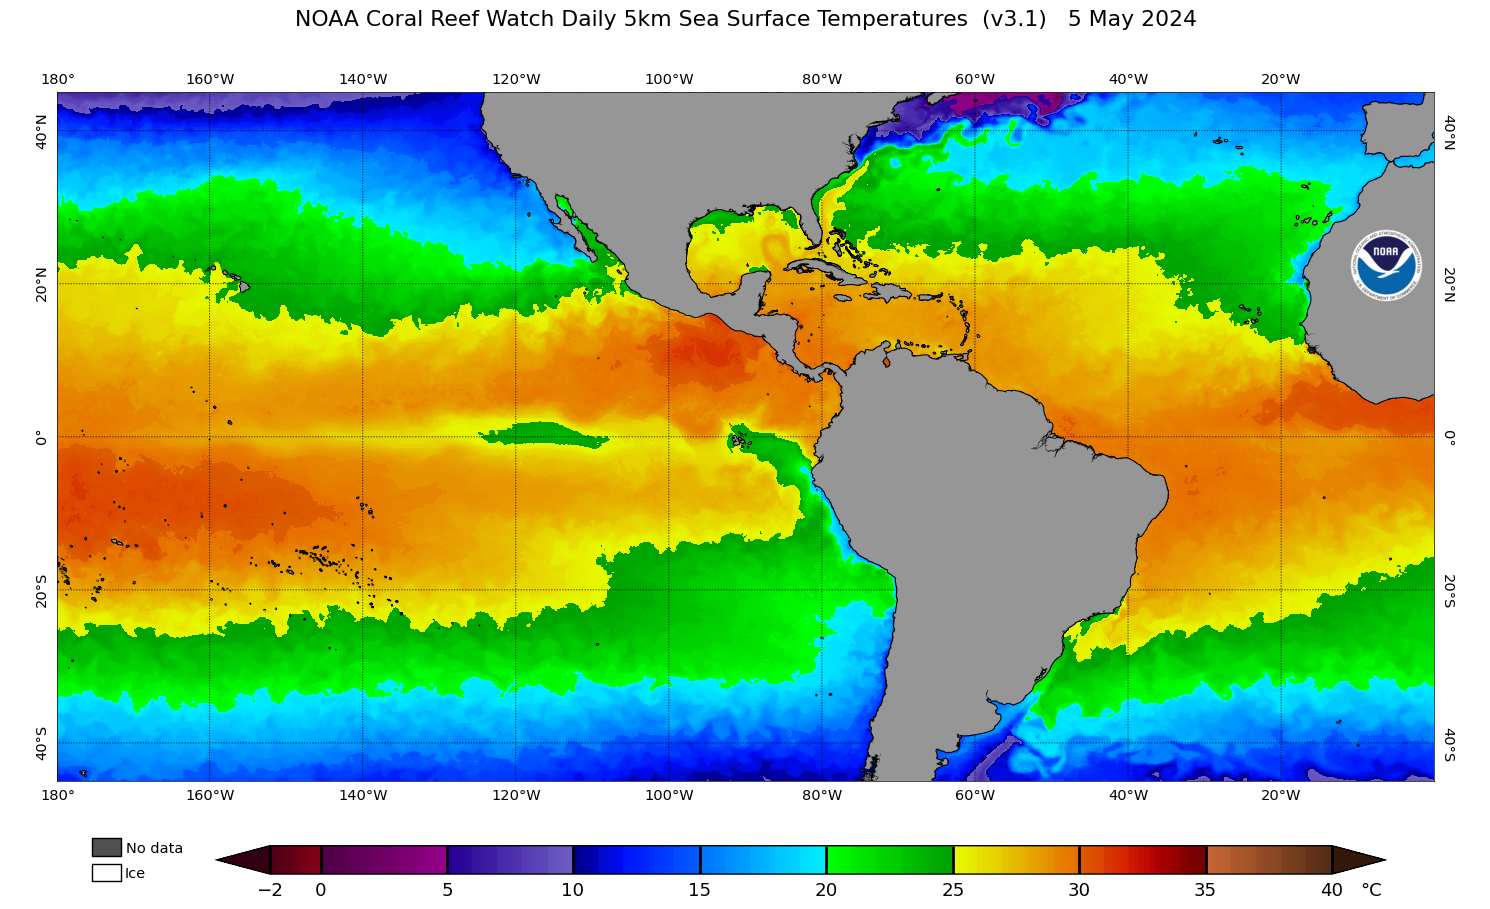
SST - Tropics
Credits: coralreefwatch.noaa.gov
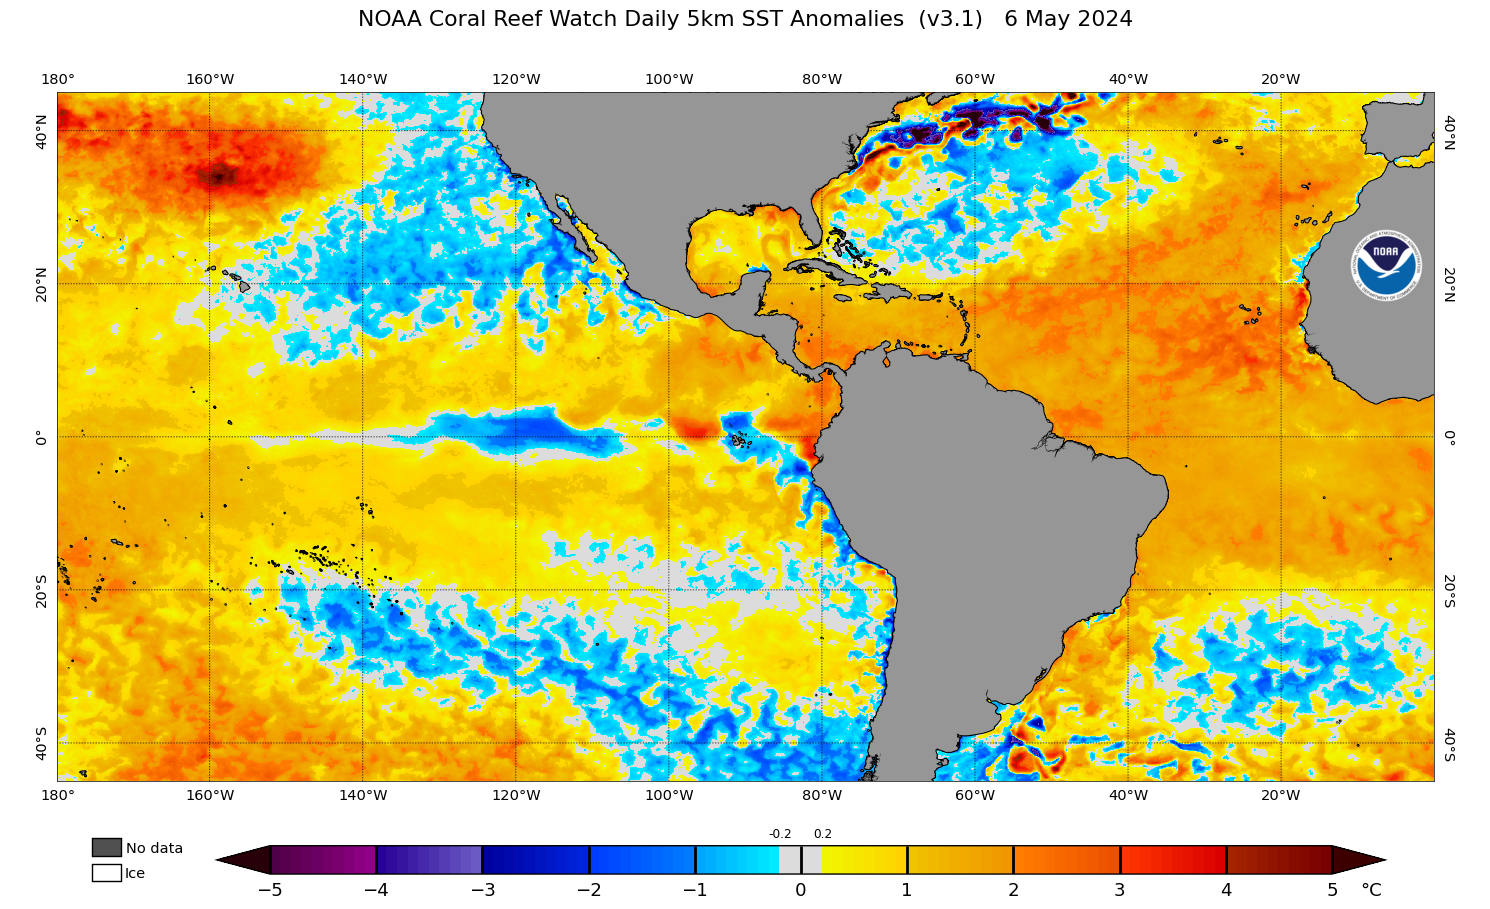
SSTA - Tropics
Credits: coralreefwatch.noaa.gov
SST Trend - Tropics
Credits: coralreefwatch.noaa.gov
SST - East
Credits: coralreefwatch.noaa.gov
SSTA - East
Credits: coralreefwatch.noaa.gov
SST Trend - East
Credits: coralreefwatch.noaa.gov
SST - West
Credits: coralreefwatch.noaa.gov
SSTA - West
Credits: coralreefwatch.noaa.gov
SST Trend - West
Credits: coralreefwatch.noaa.gov
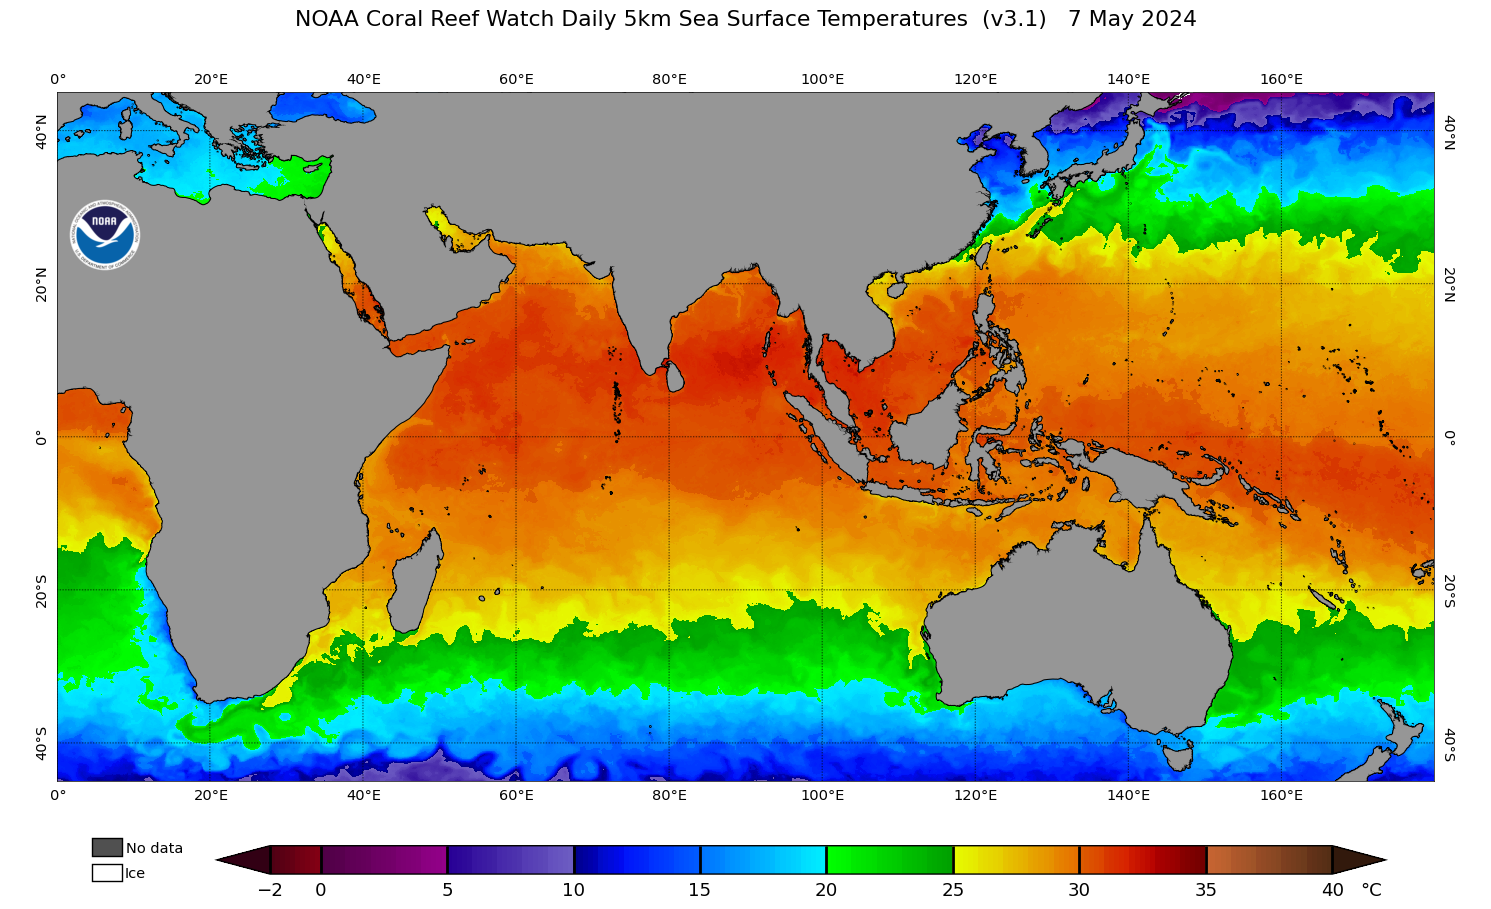
SST - Pacific Ocean

Credits: coralreefwatch.noaa.gov
SSTA - Pacific Ocean
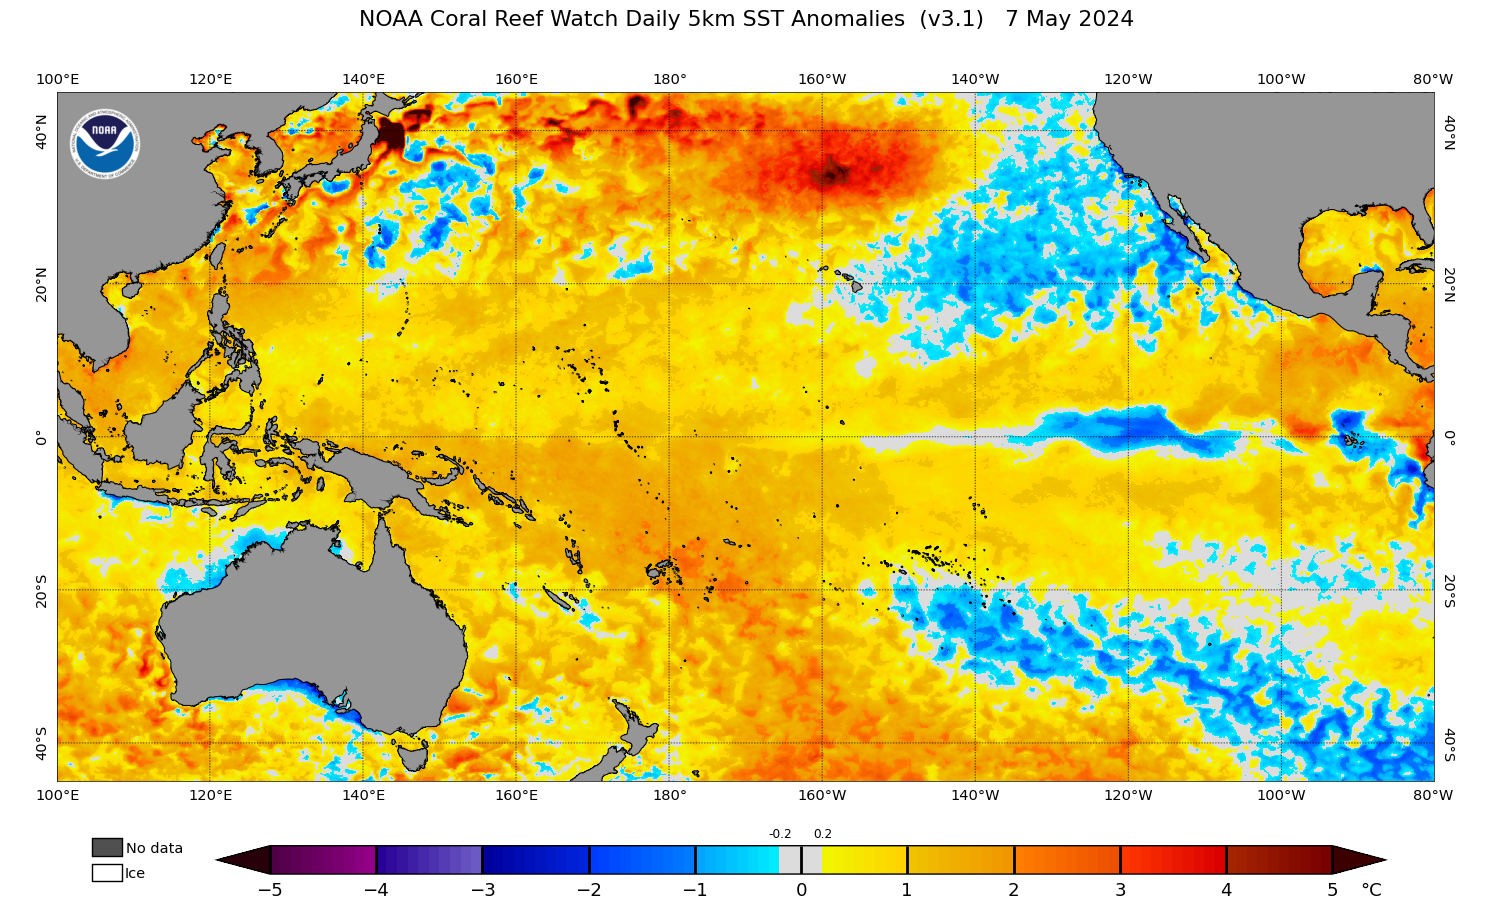
Credits: coralreefwatch.noaa.gov
SST Trend - Pacific Ocean
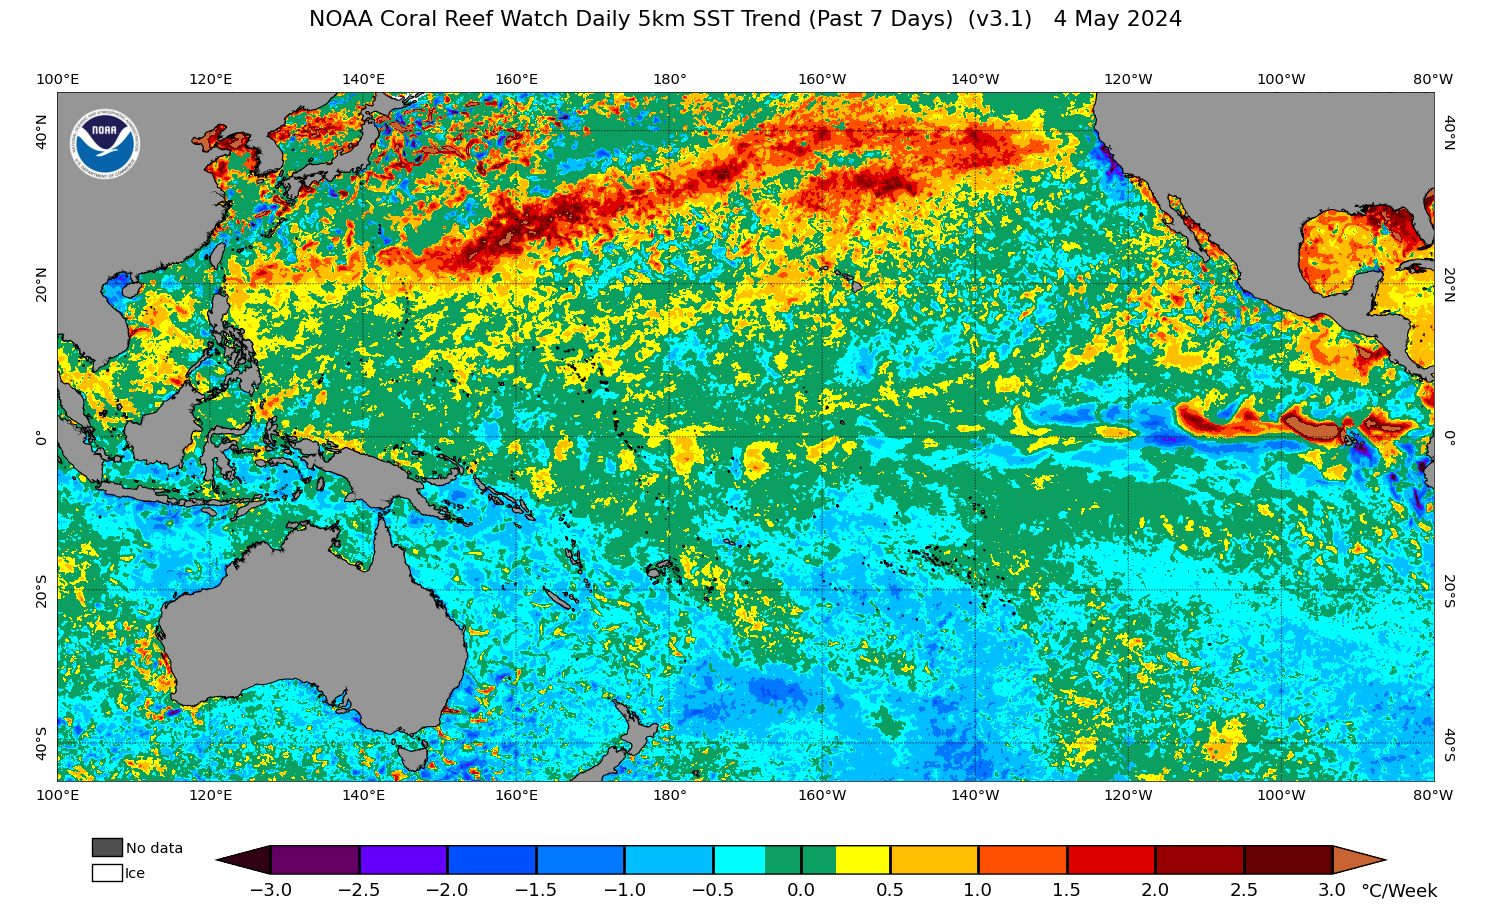
Credits: coralreefwatch.noaa.gov
SST - Indian Ocean
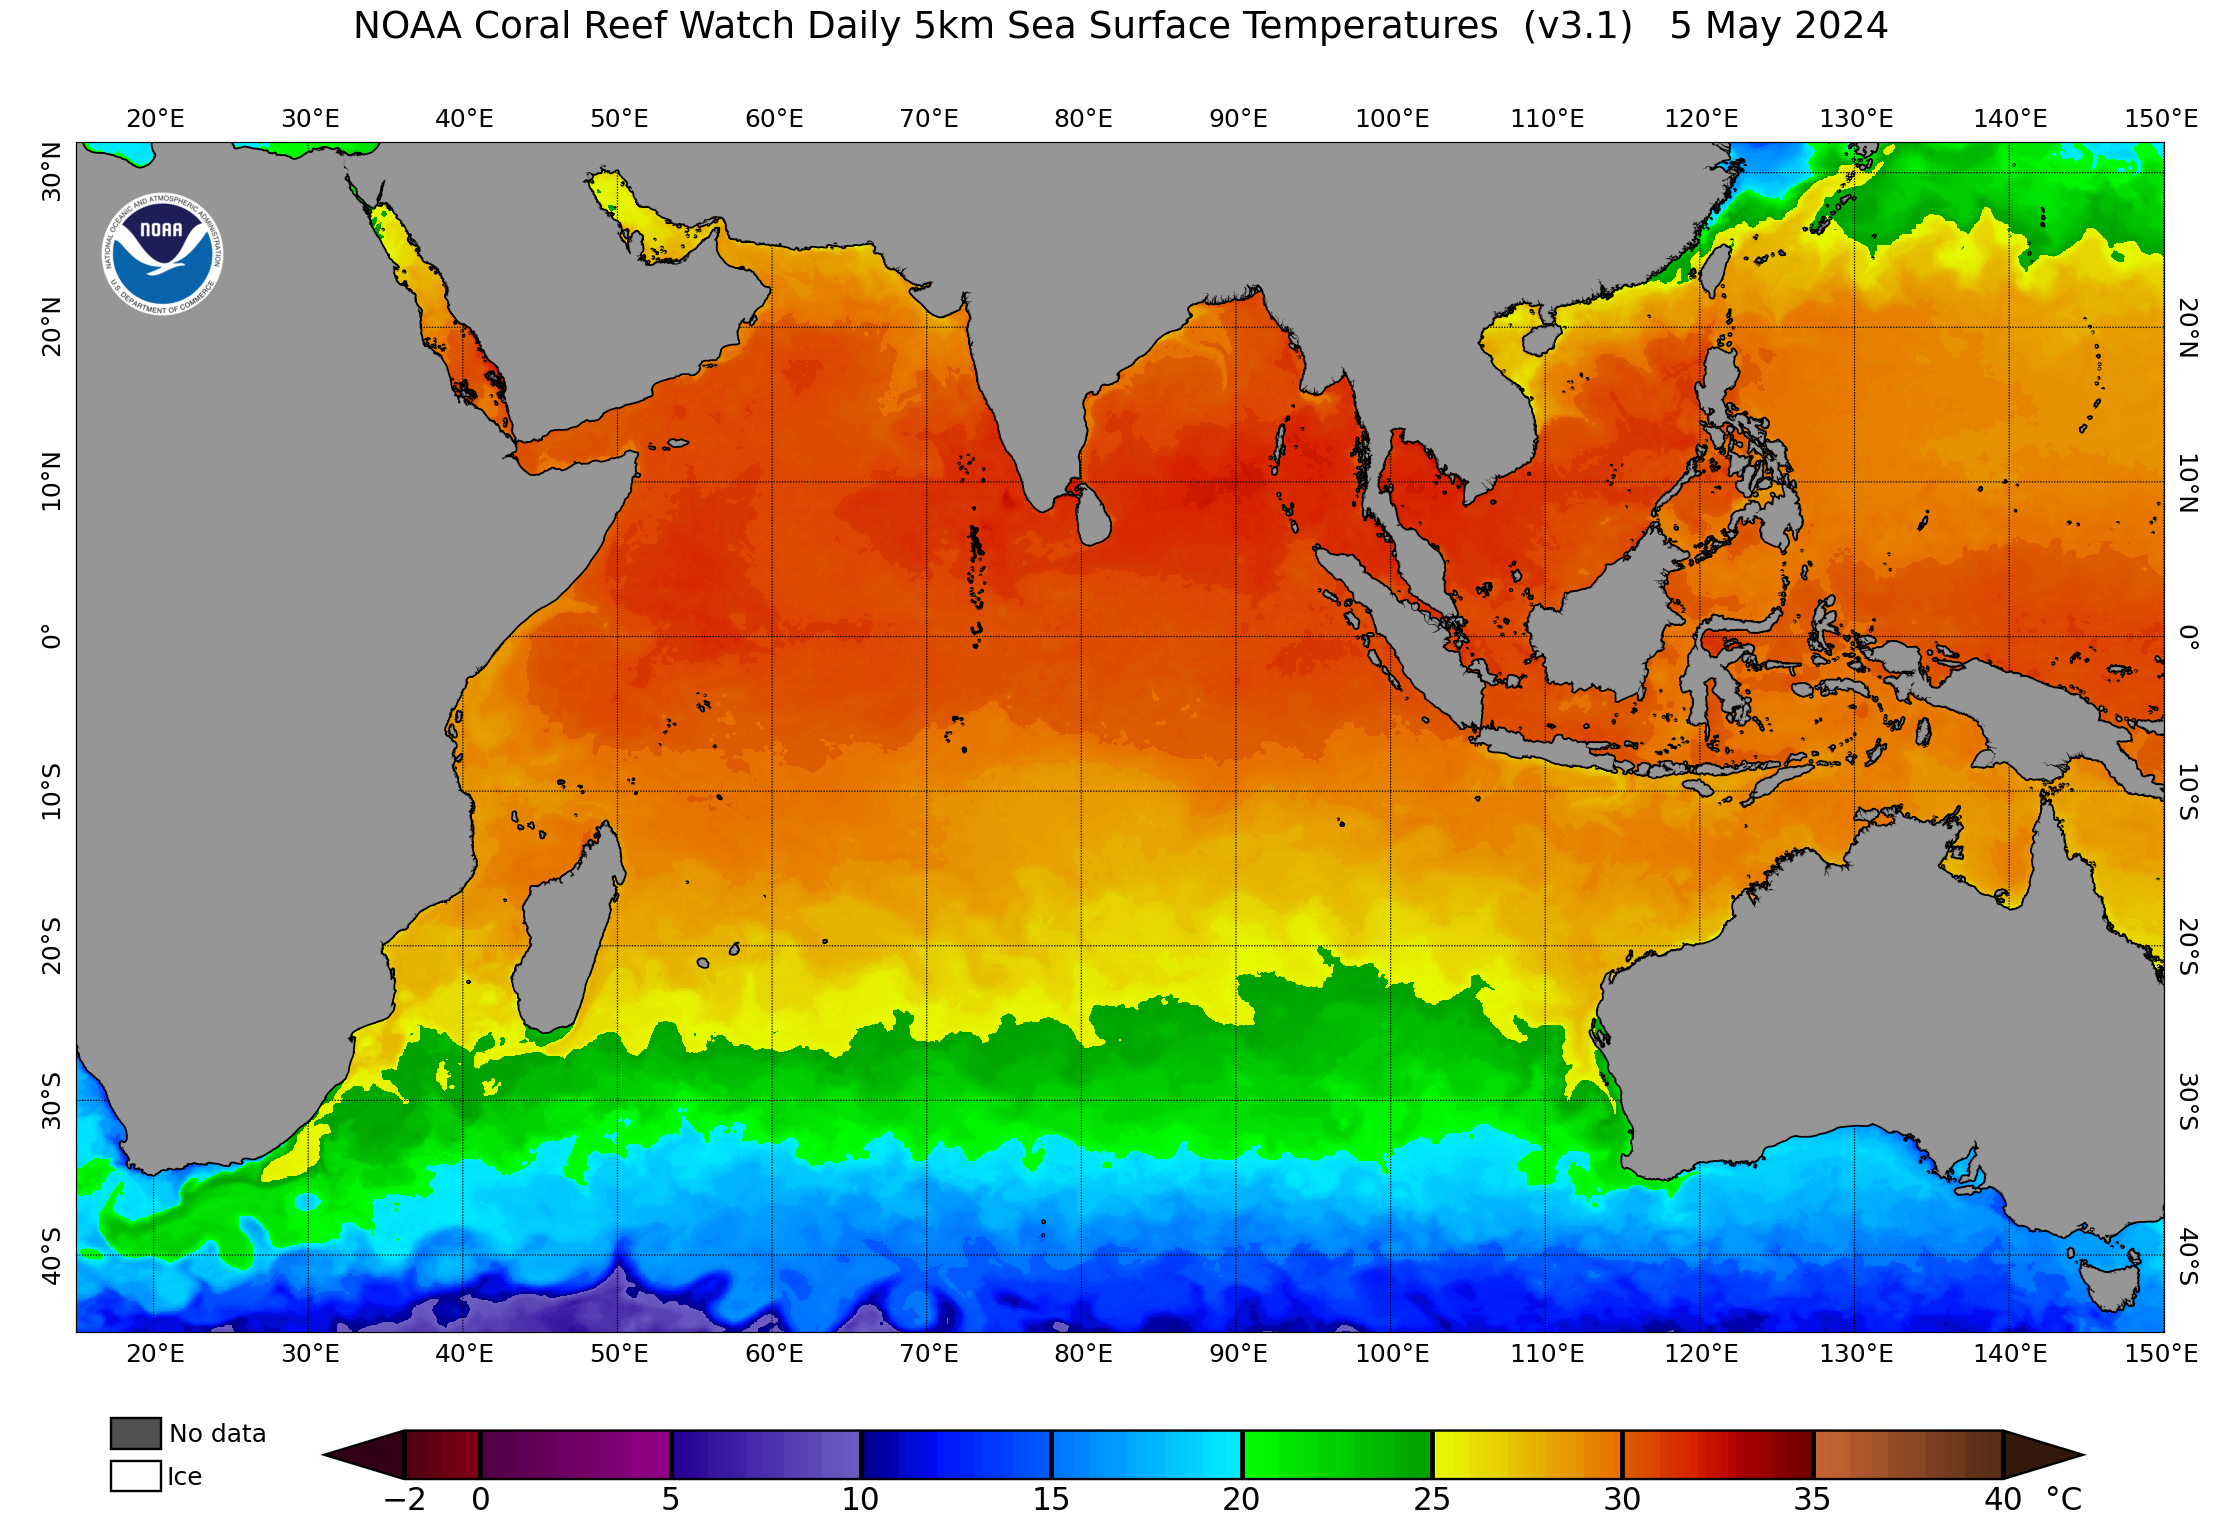
Credits: coralreefwatch.noaa.gov
SSTA - Indian Ocean
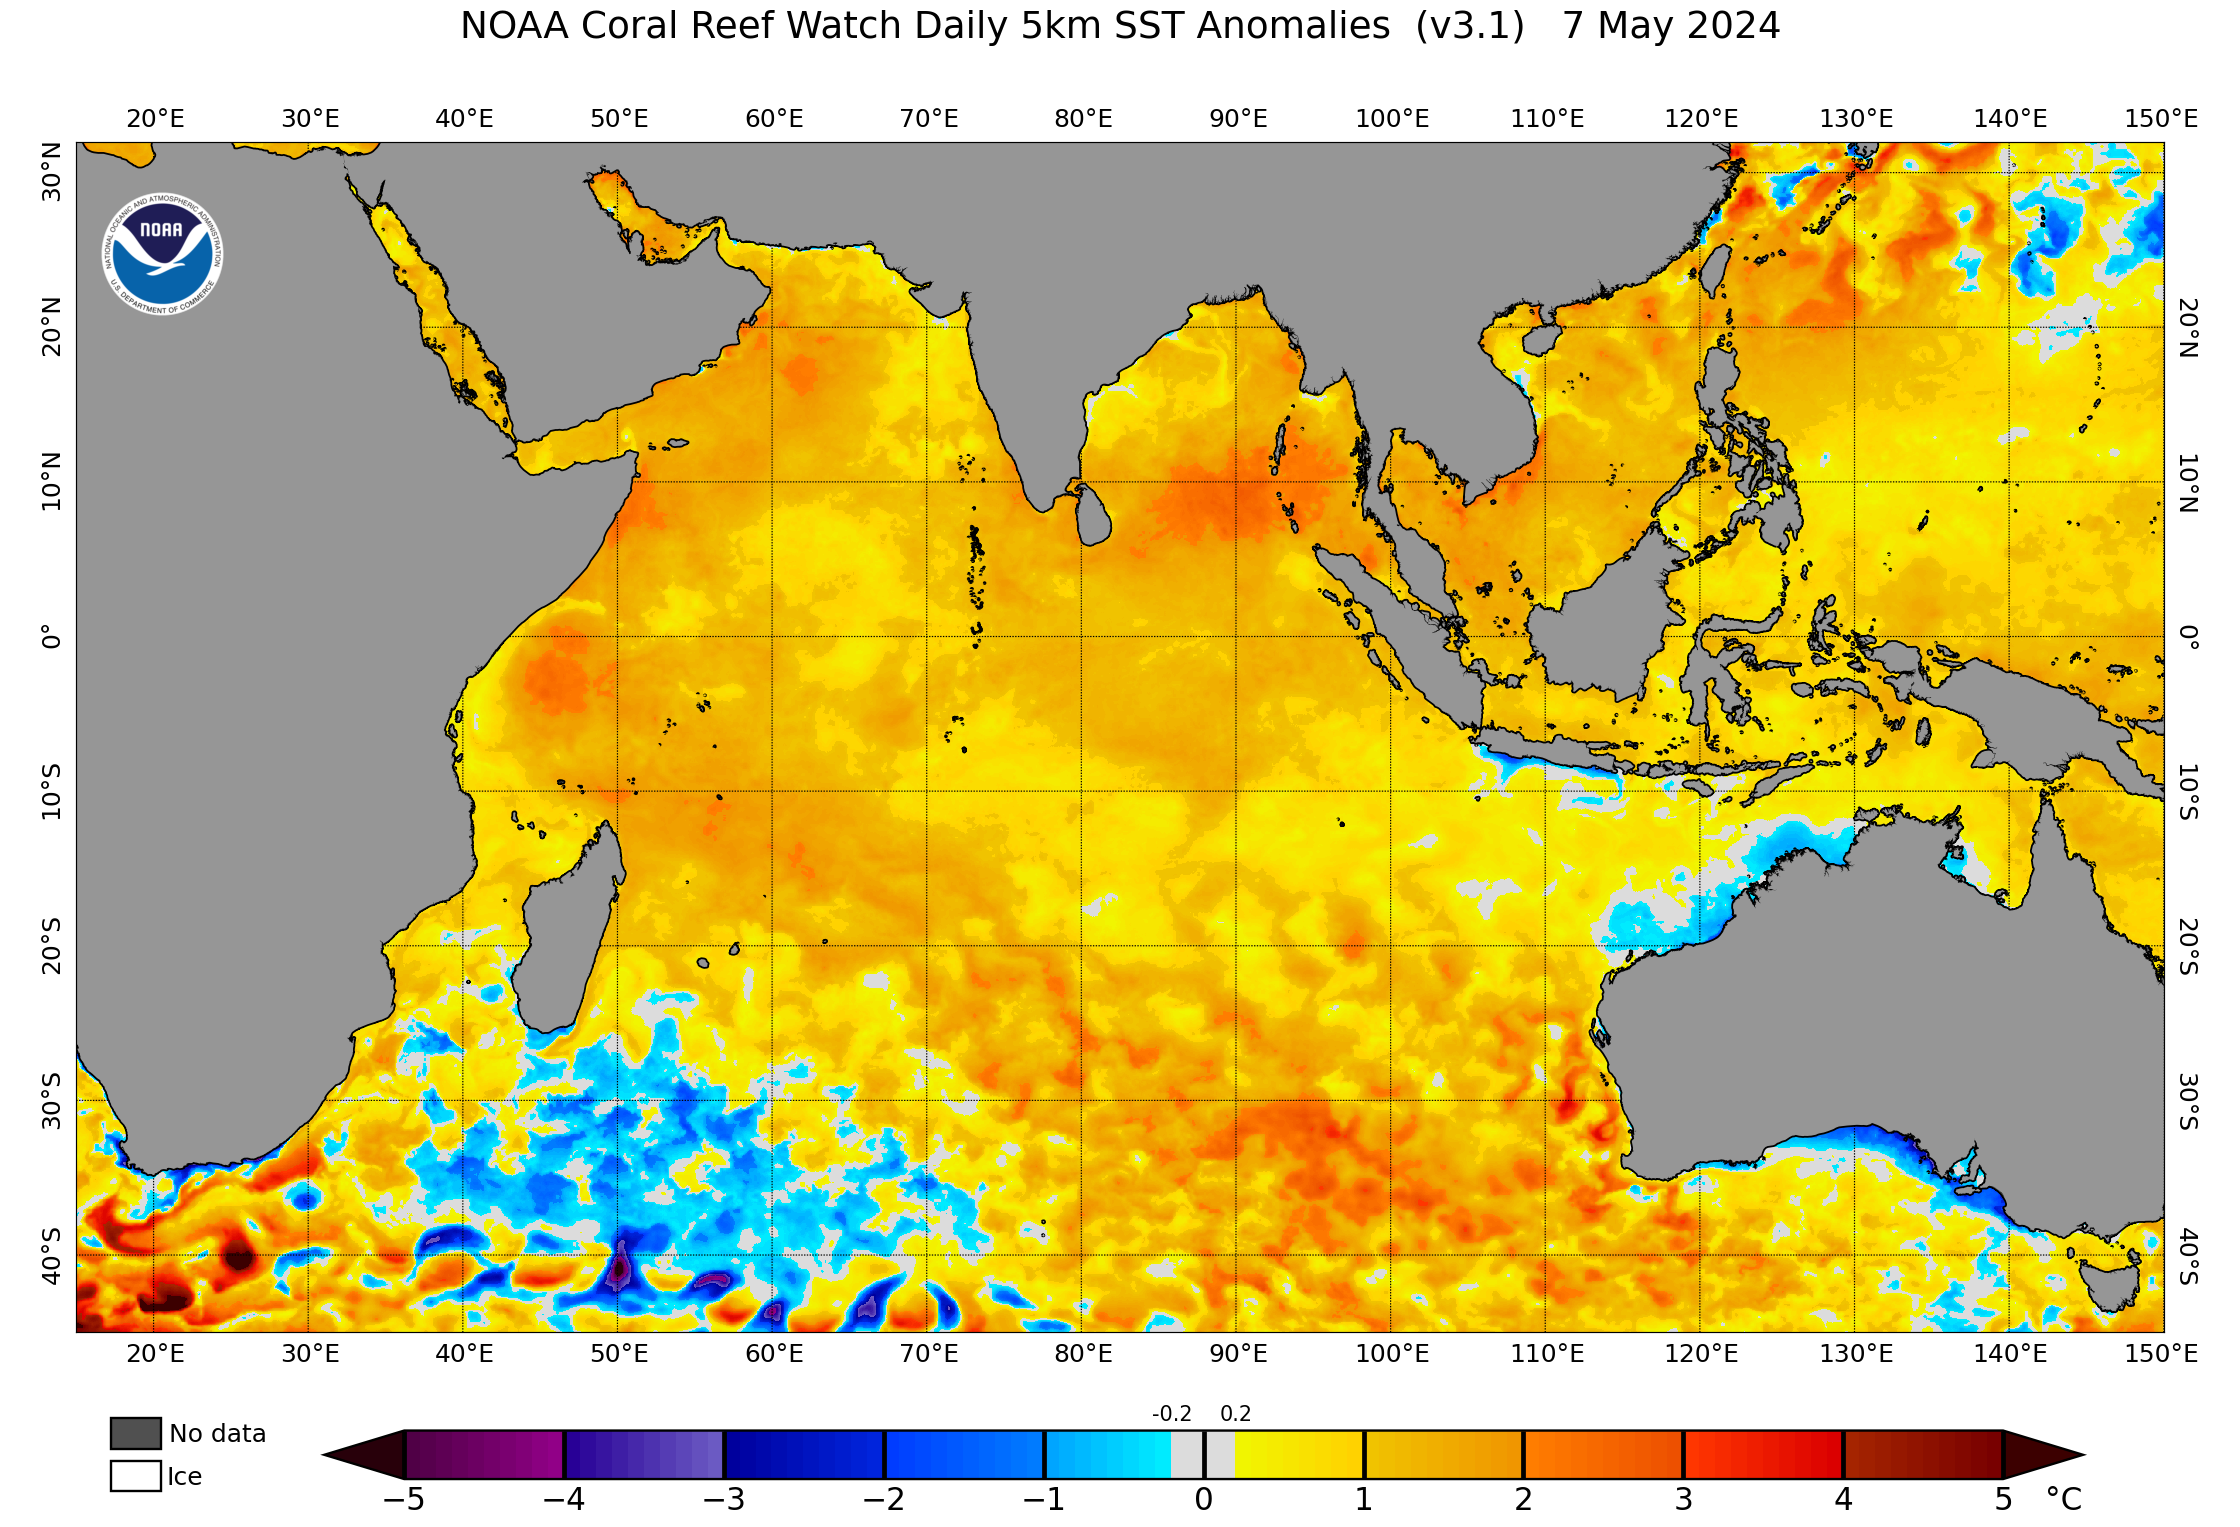
Credits: coralreefwatch.noaa.gov
SST Trend - Indian Ocean
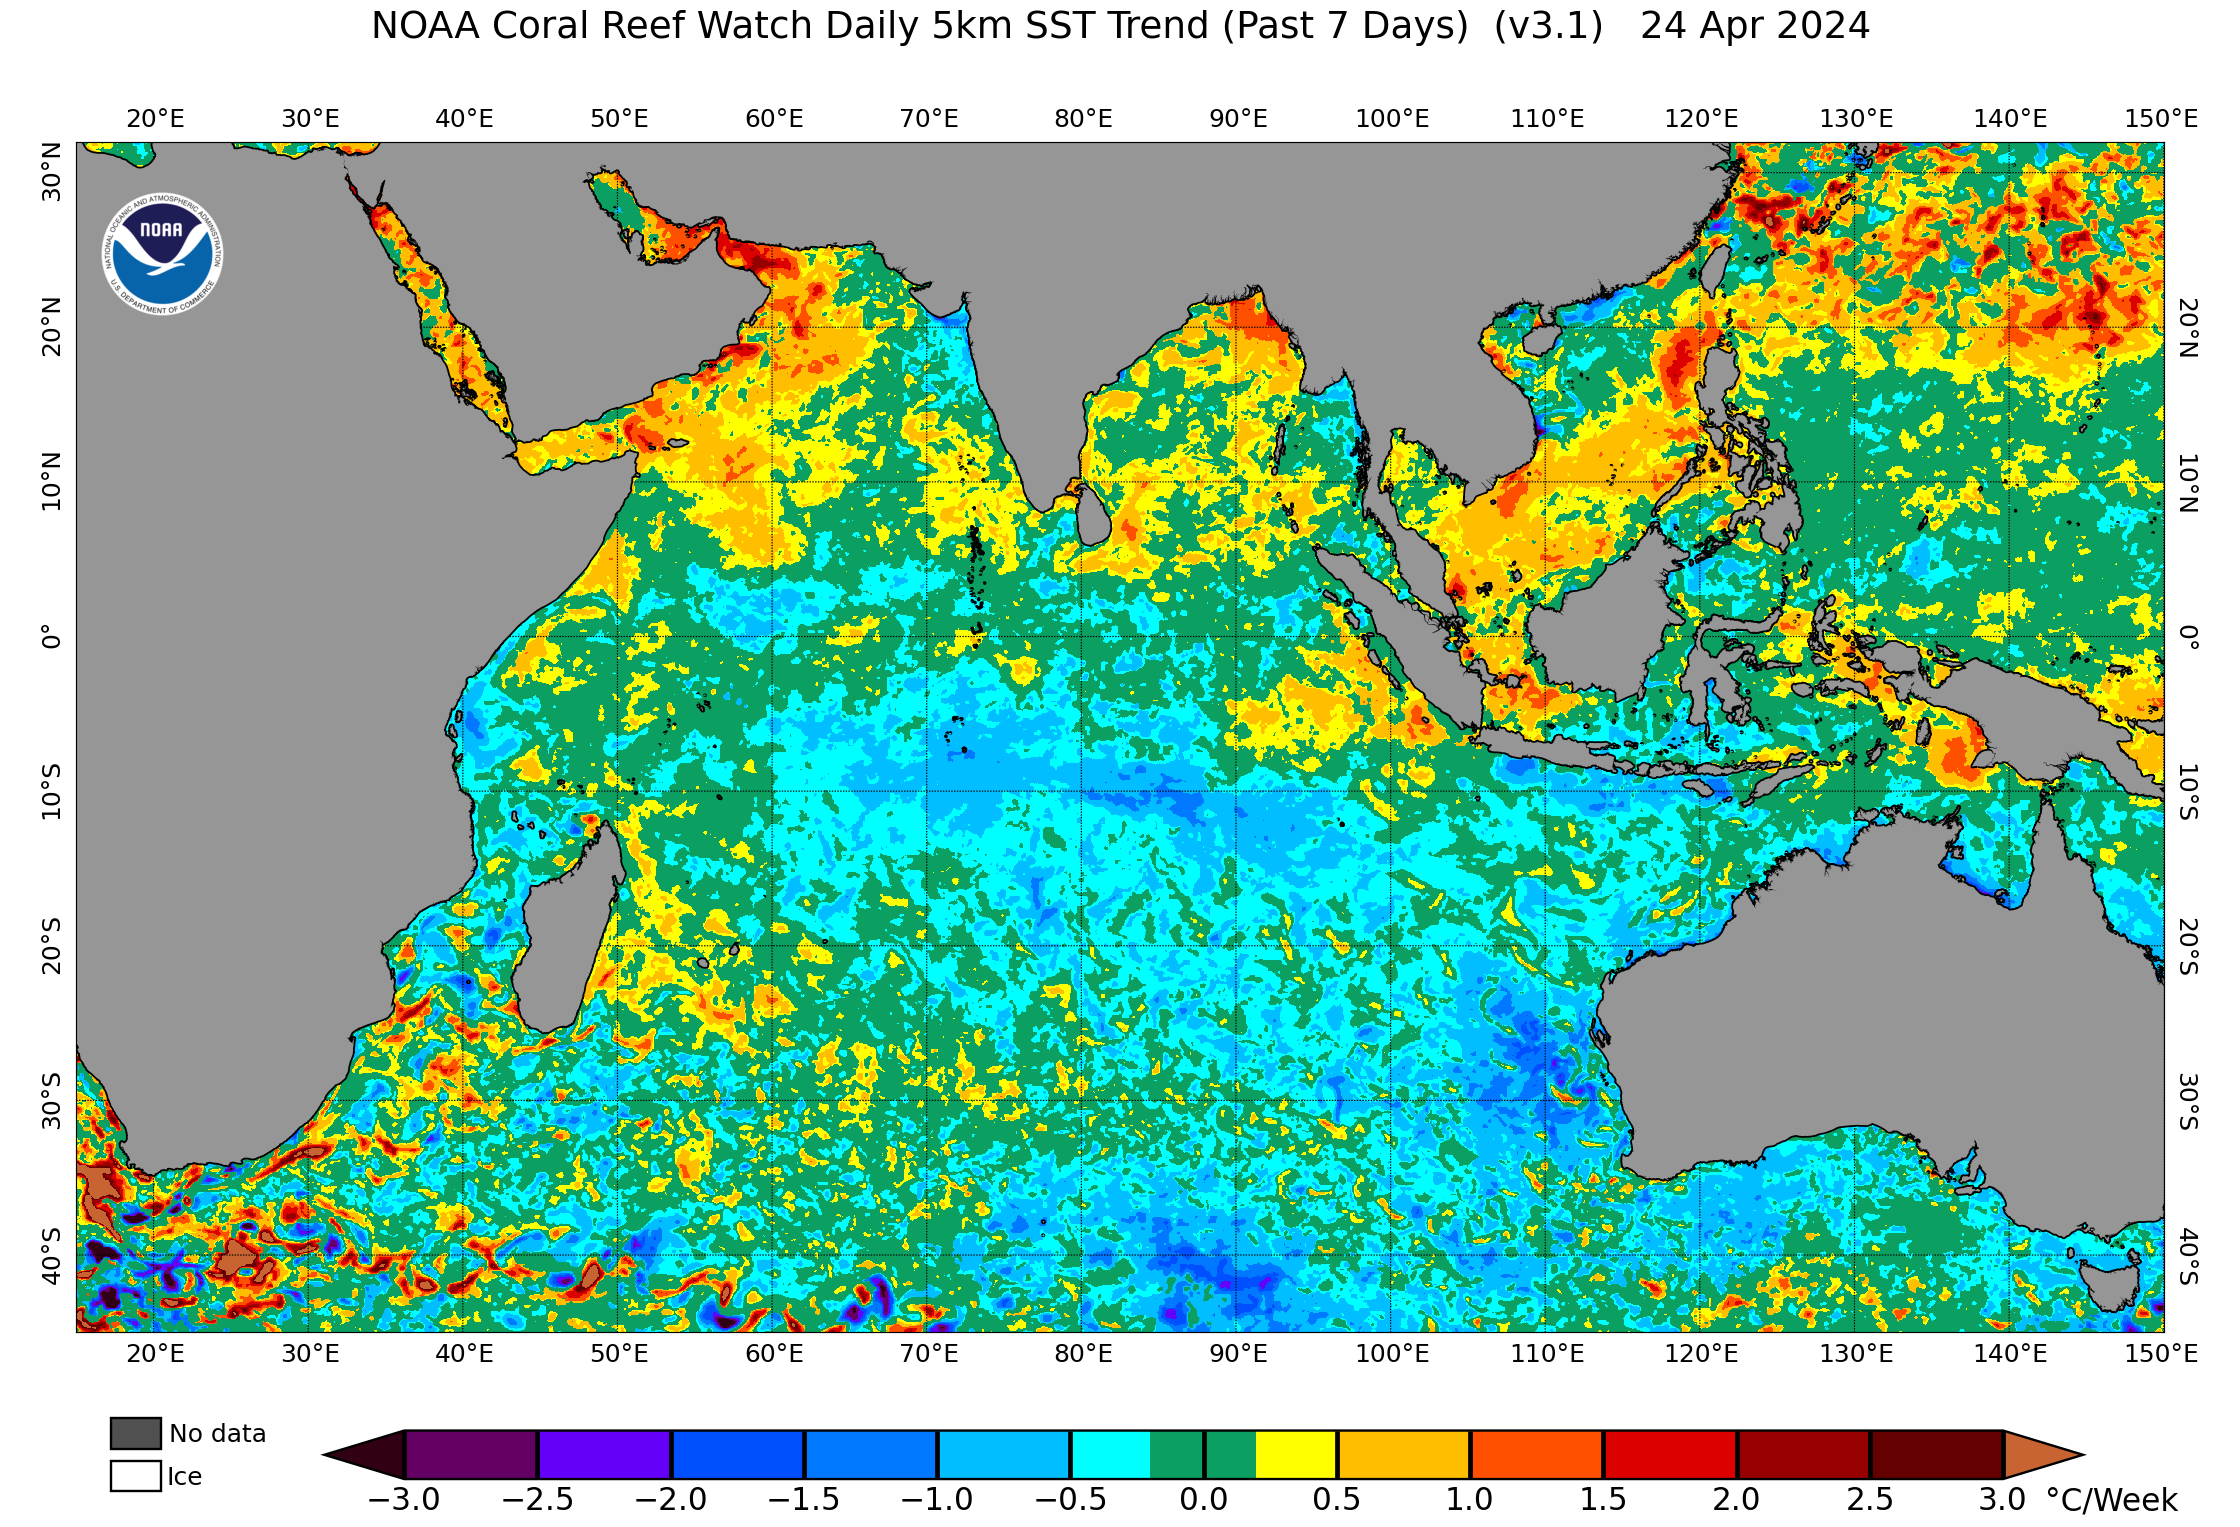
Credits: coralreefwatch.noaa.gov
SST - South Atlantic
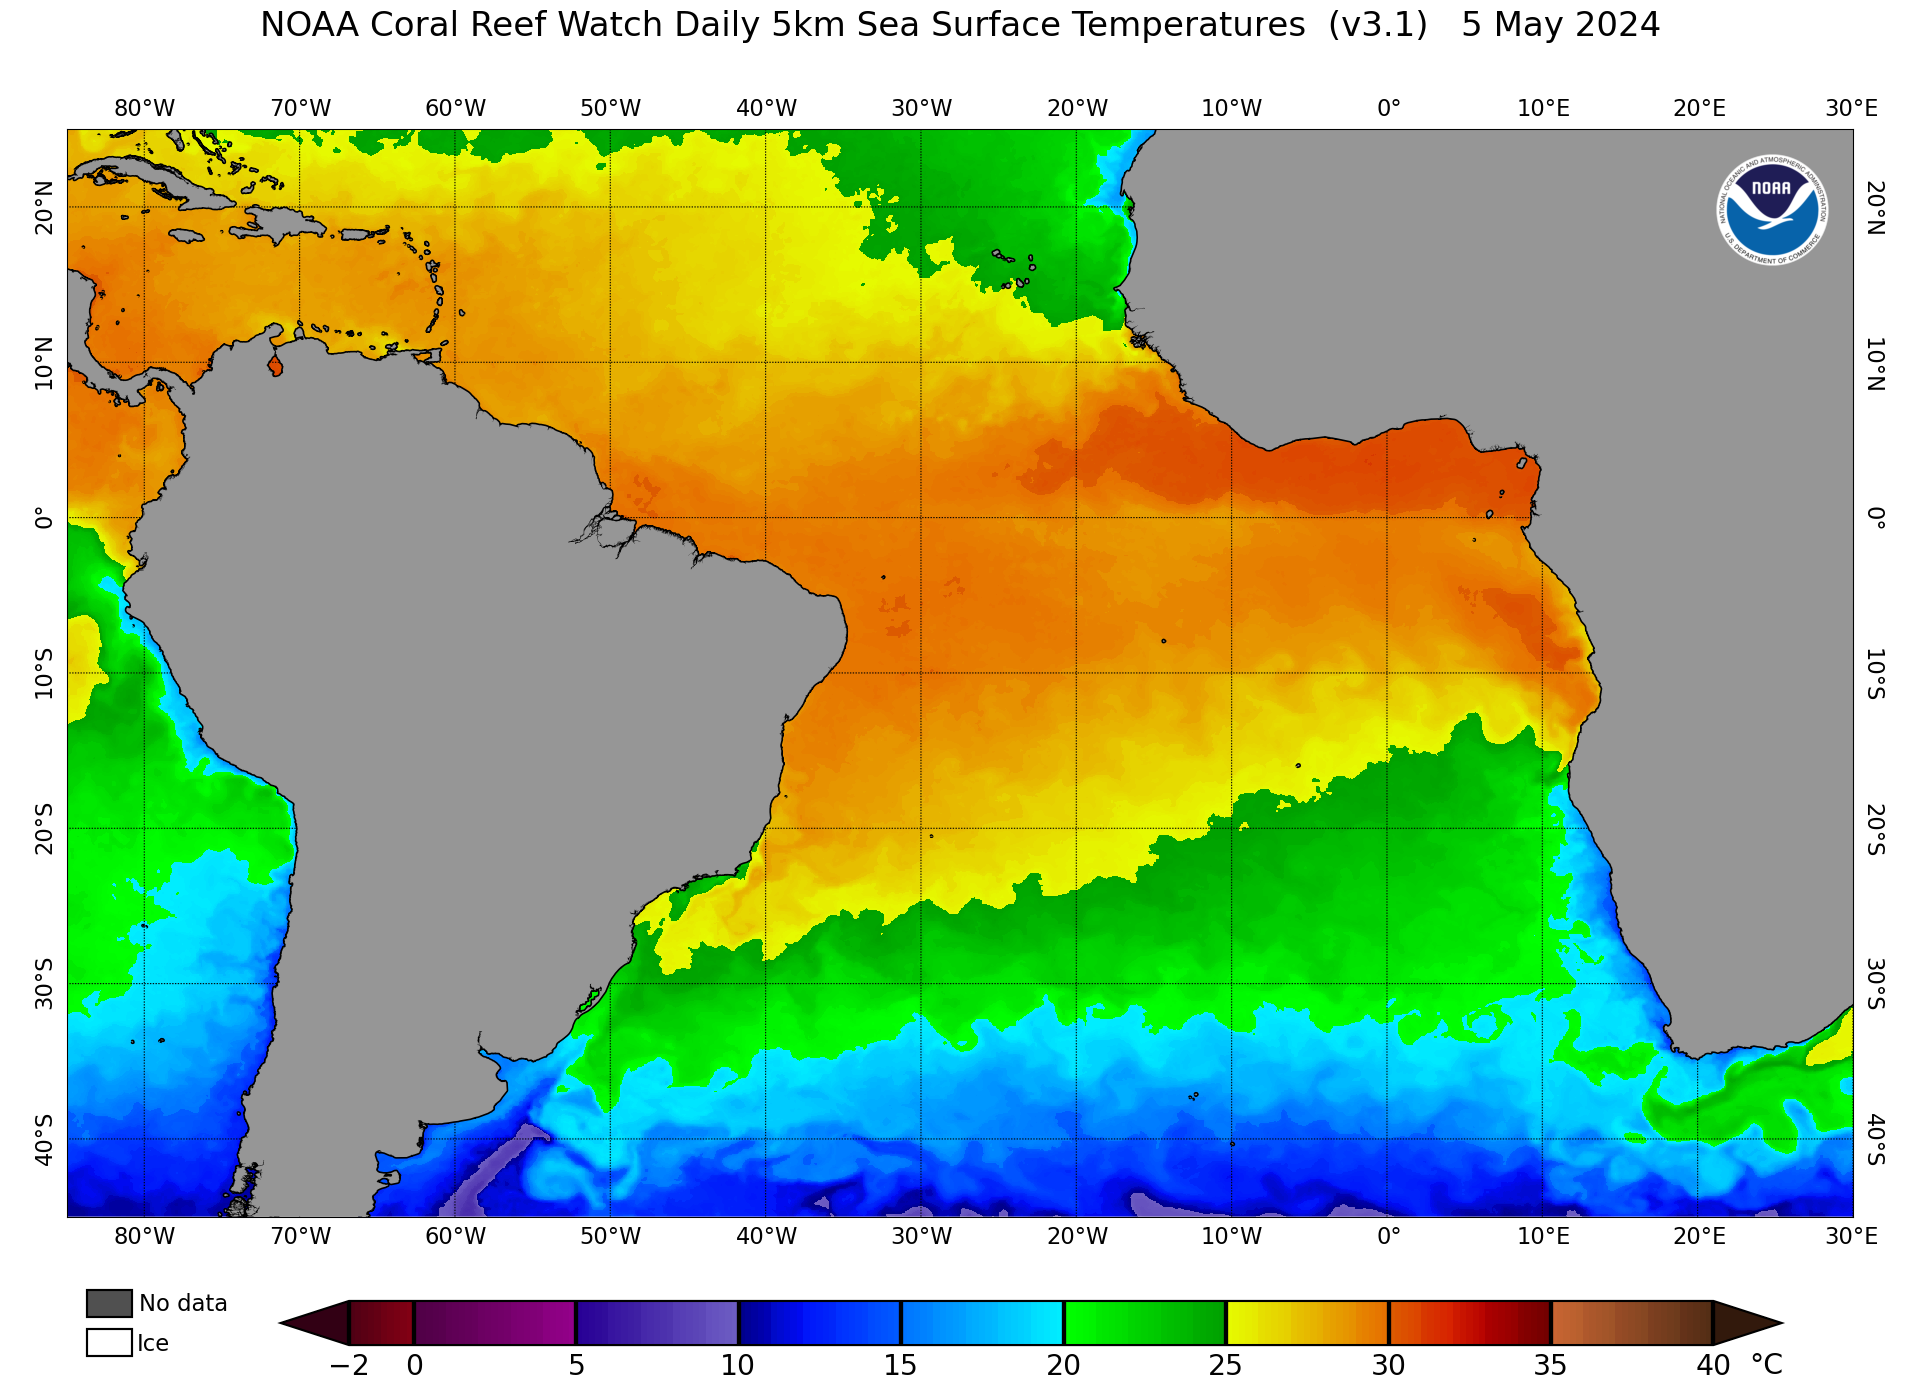
Credits: coralreefwatch.noaa.gov
SSTA - South Atlantic
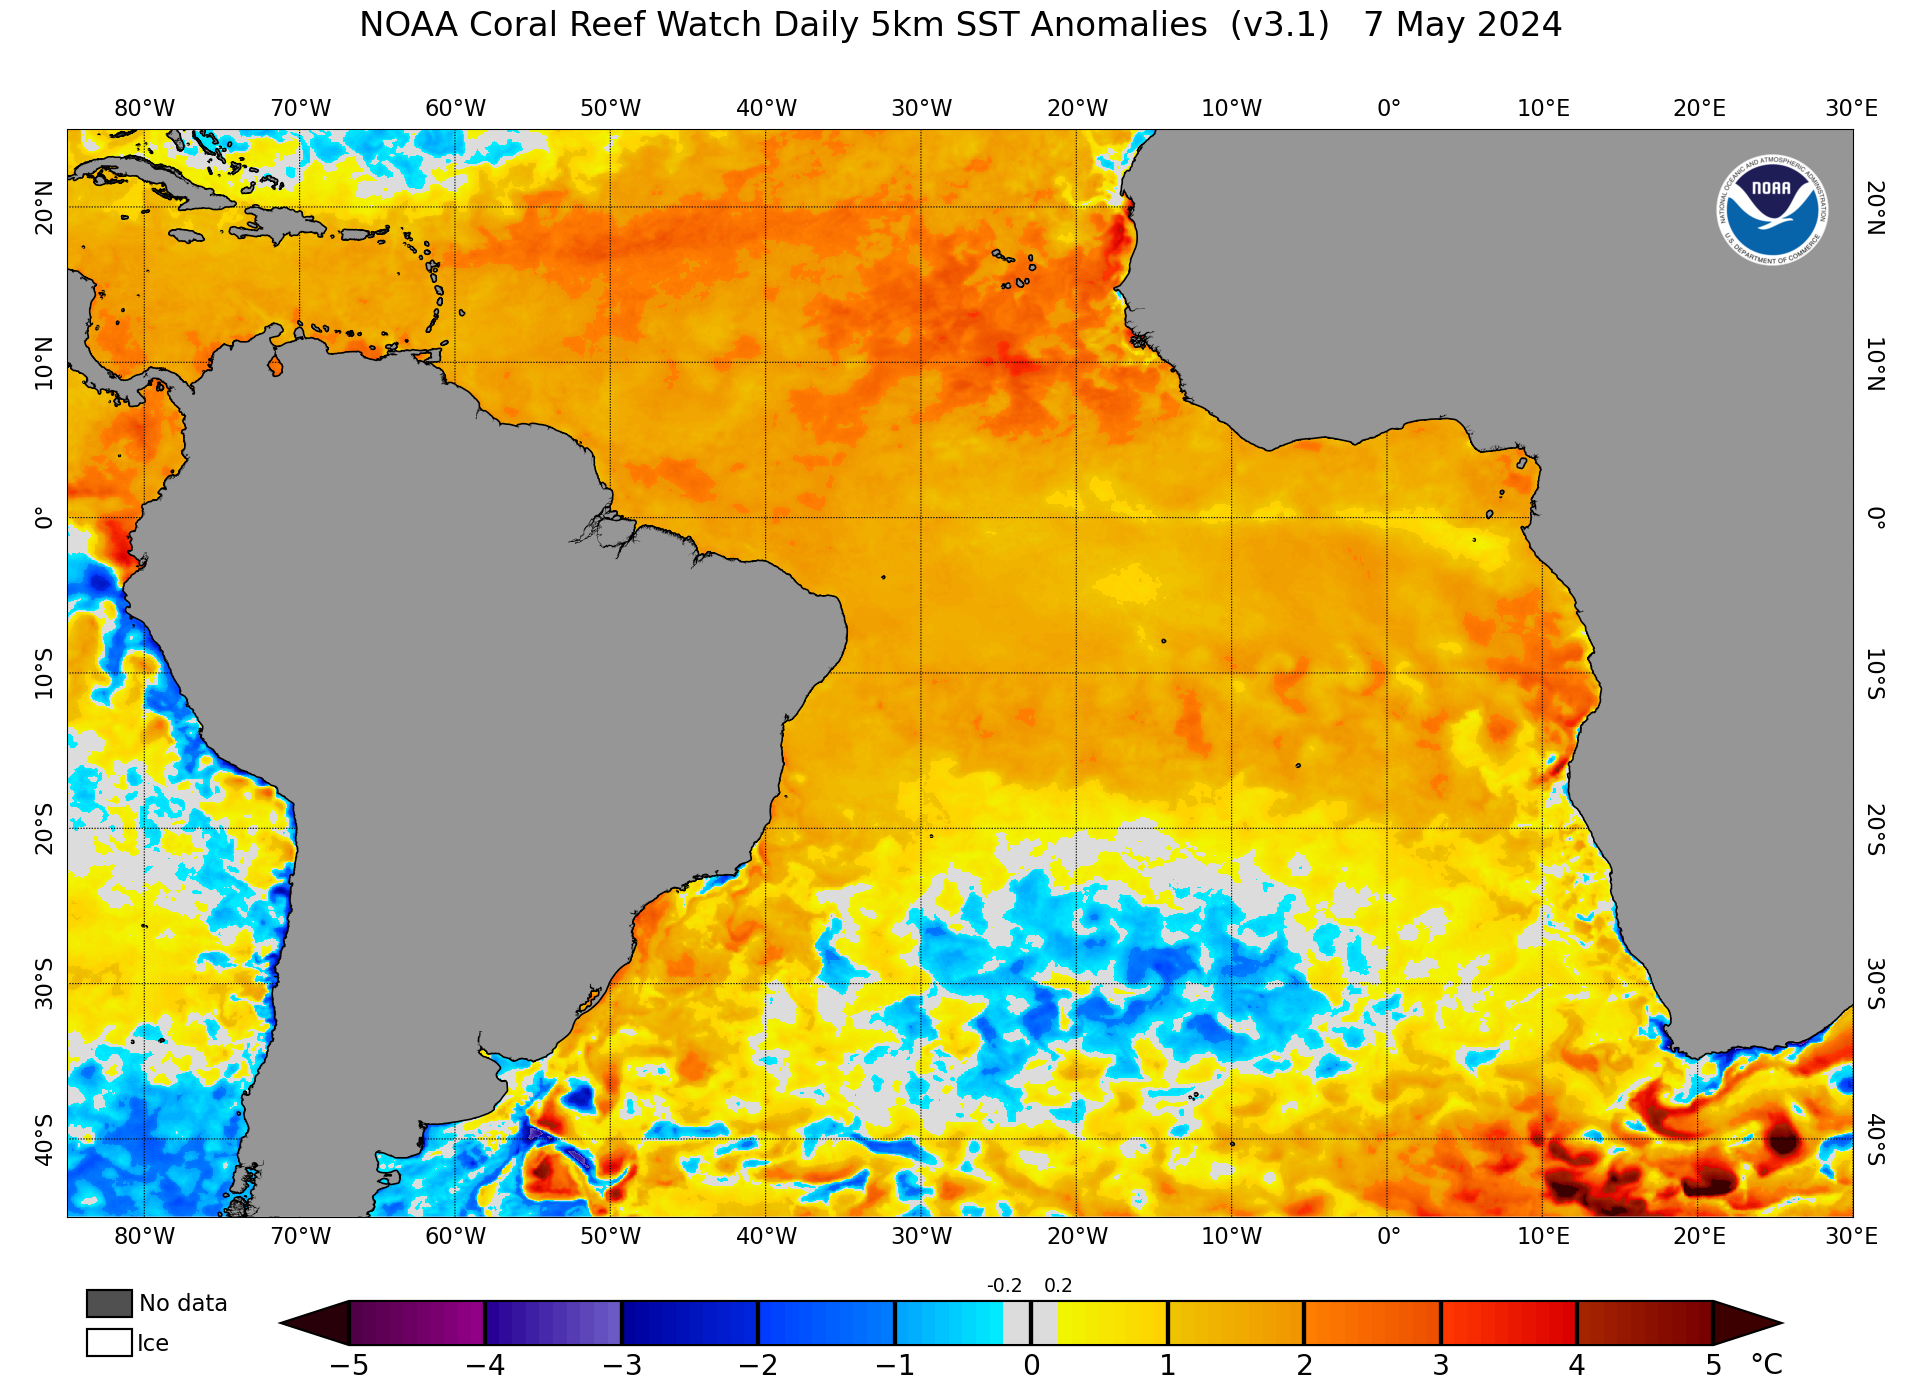
Credits: coralreefwatch.noaa.gov
SST Trend - South Atlantic
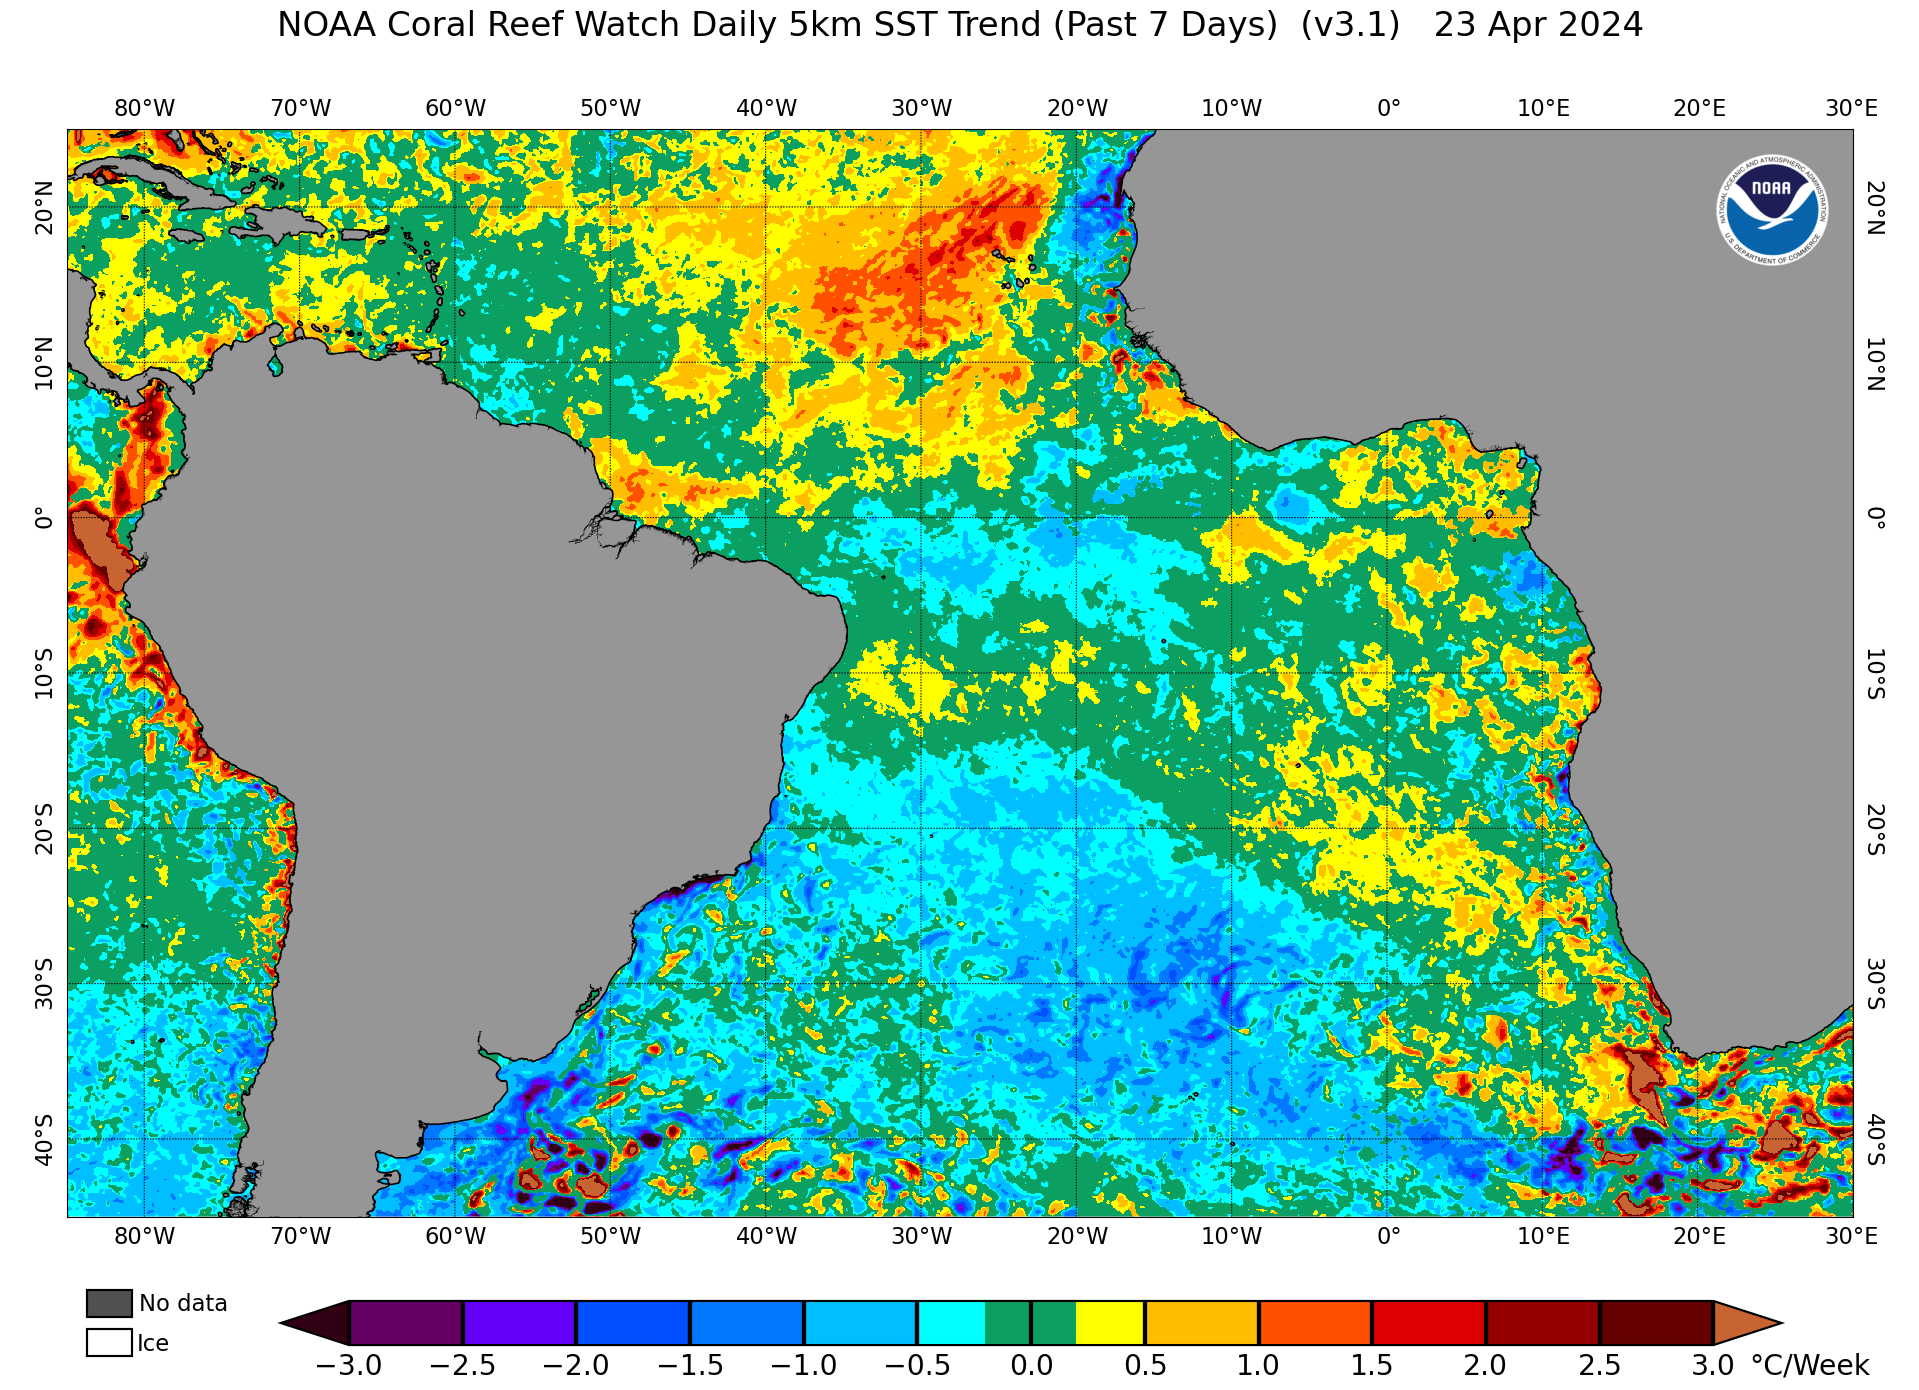
Credits: coralreefwatch.noaa.gov
SST - Coral Triangle
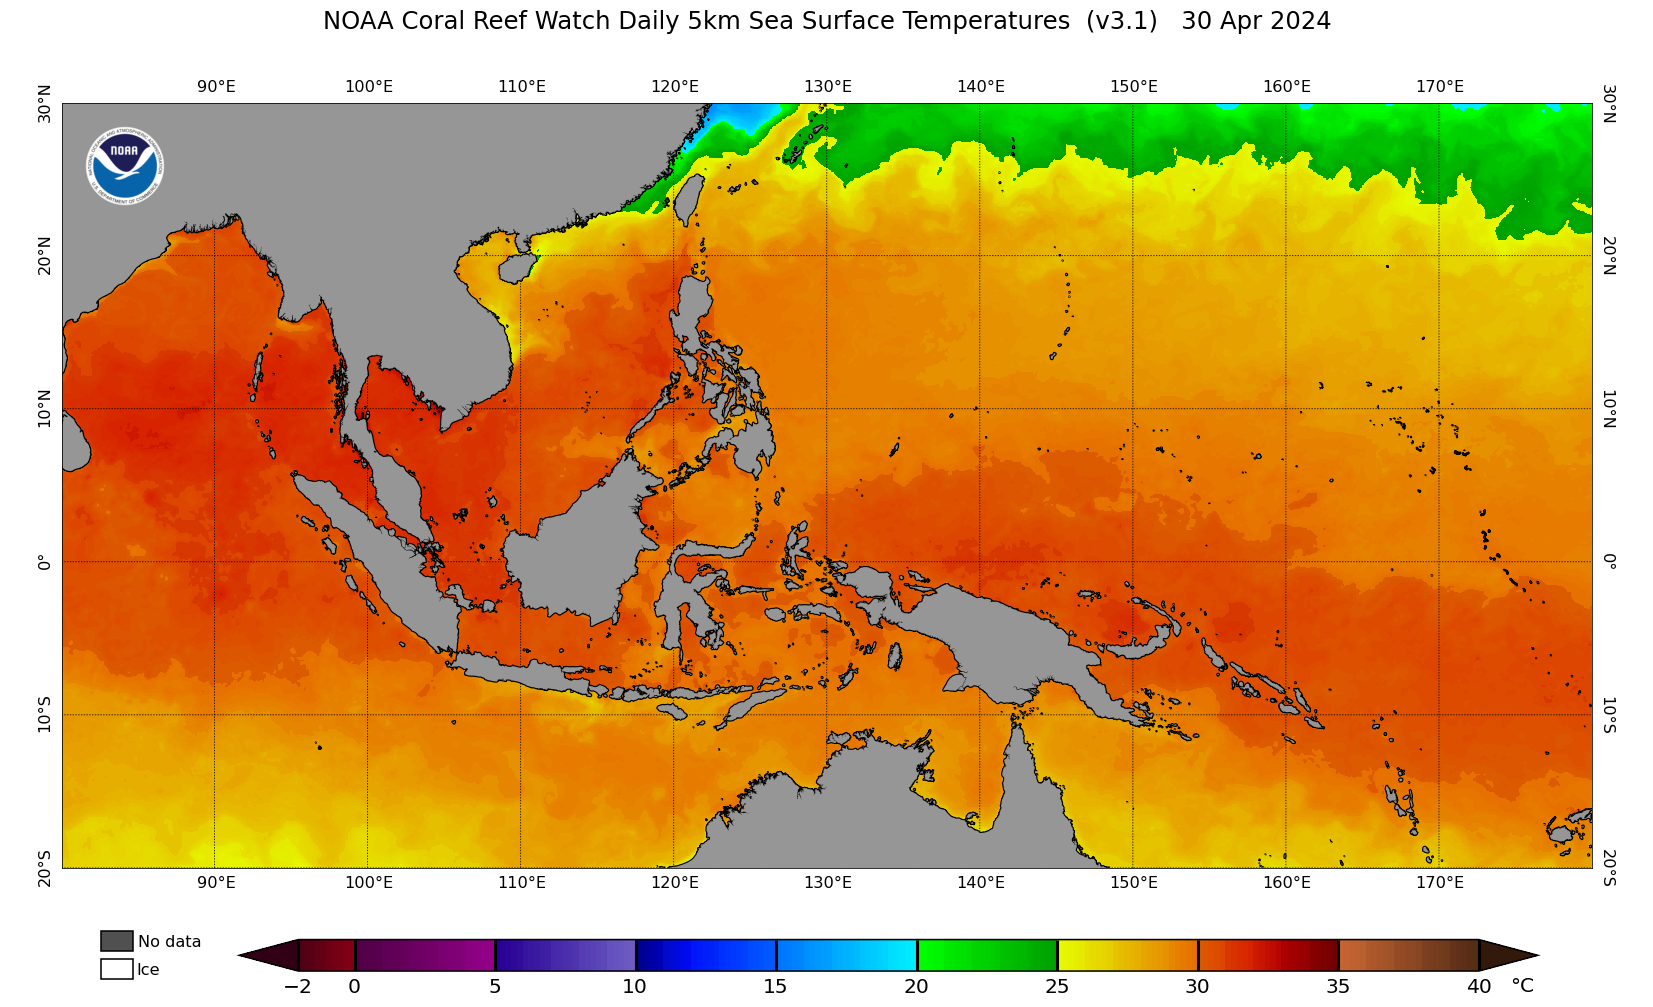
Credits: coralreefwatch.noaa.gov
SSTA - Coral Triangle
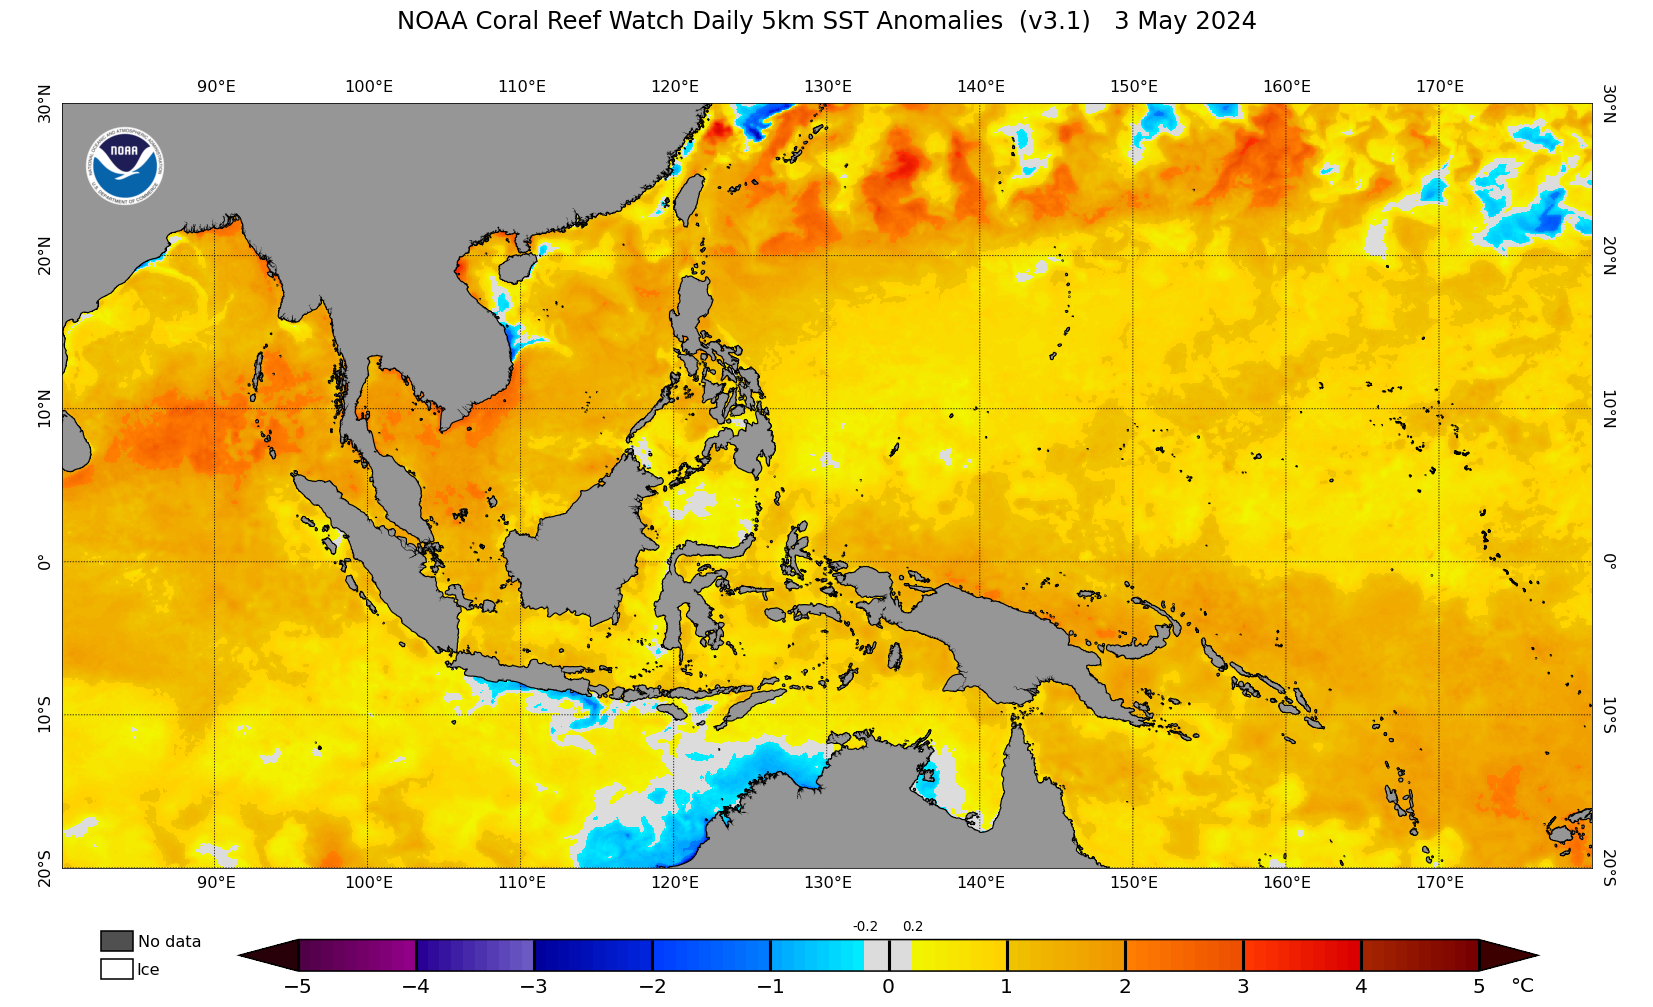
Credits: coralreefwatch.noaa.gov
SST Trend - Coral Triangle
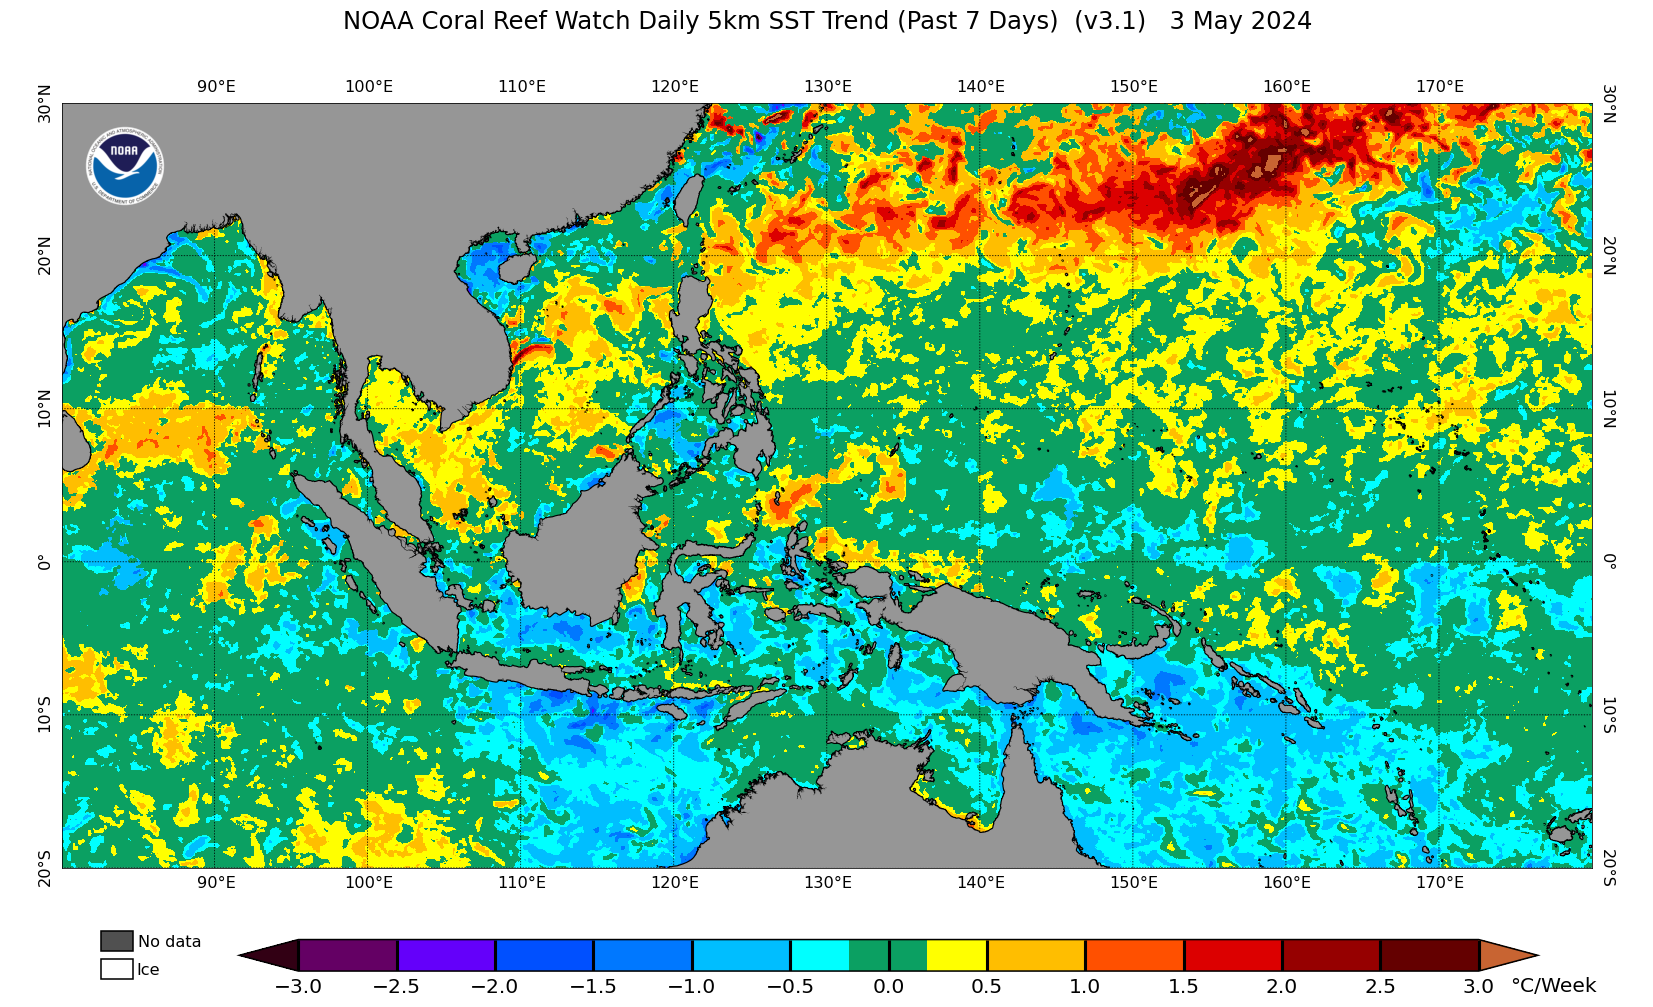
Credits: coralreefwatch.noaa.gov
SST - Caribbean
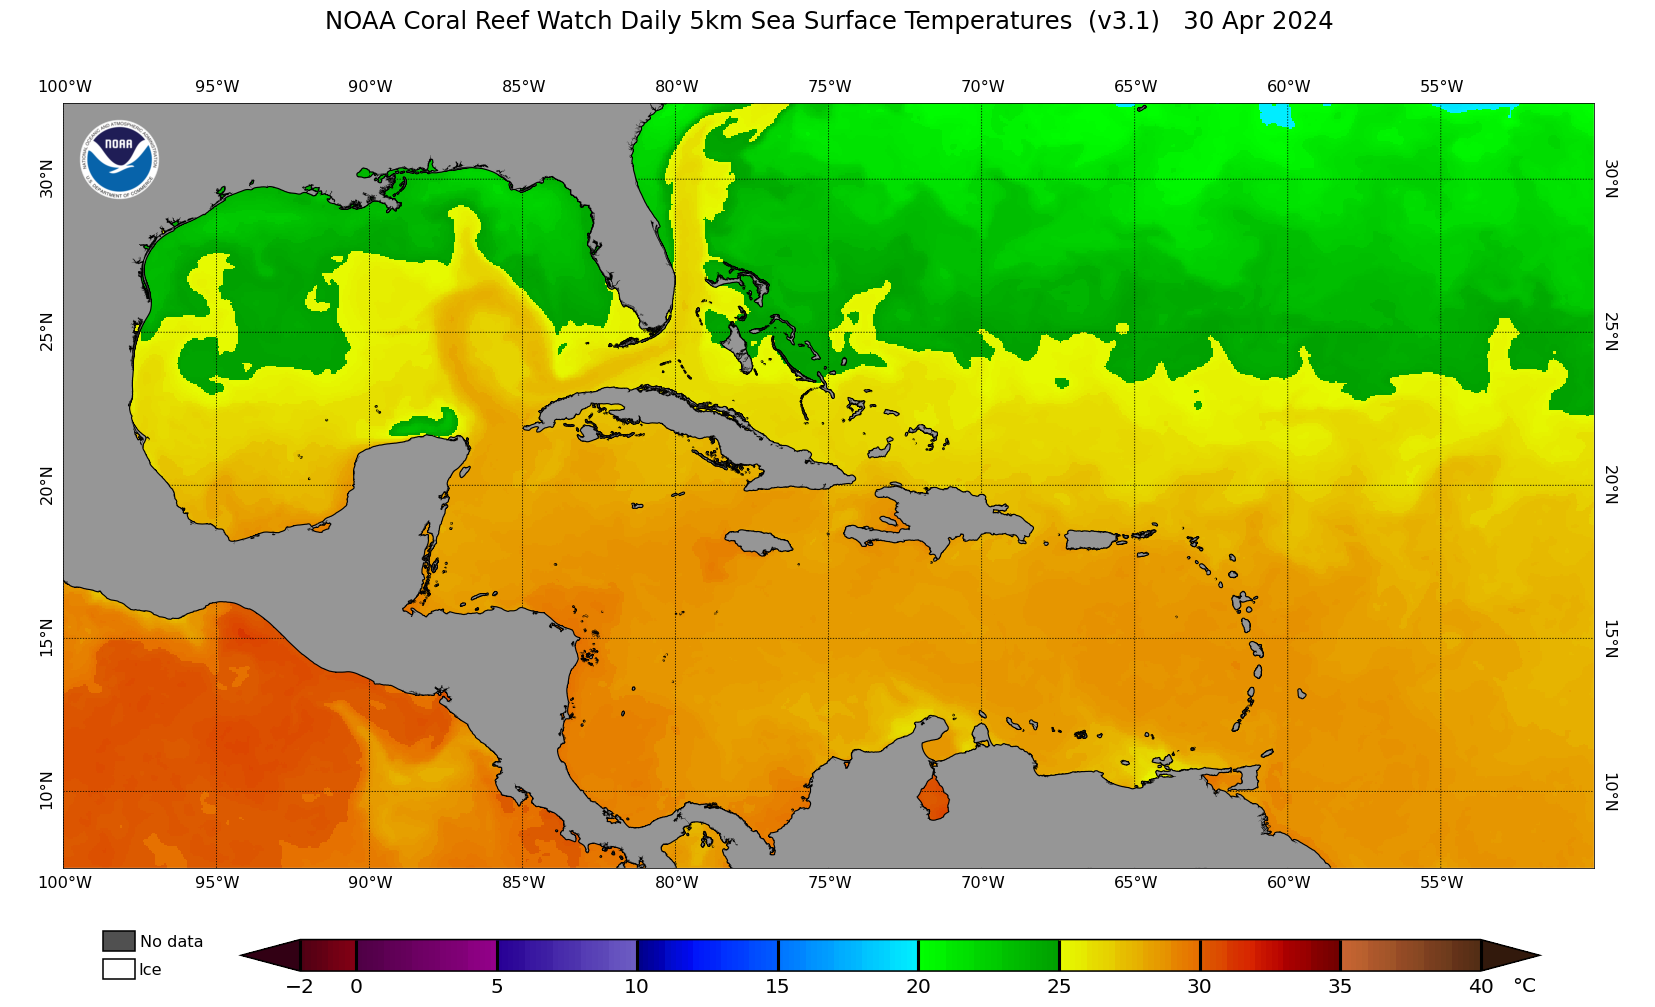
Credits: coralreefwatch.noaa.gov
SSTA - Caribbean
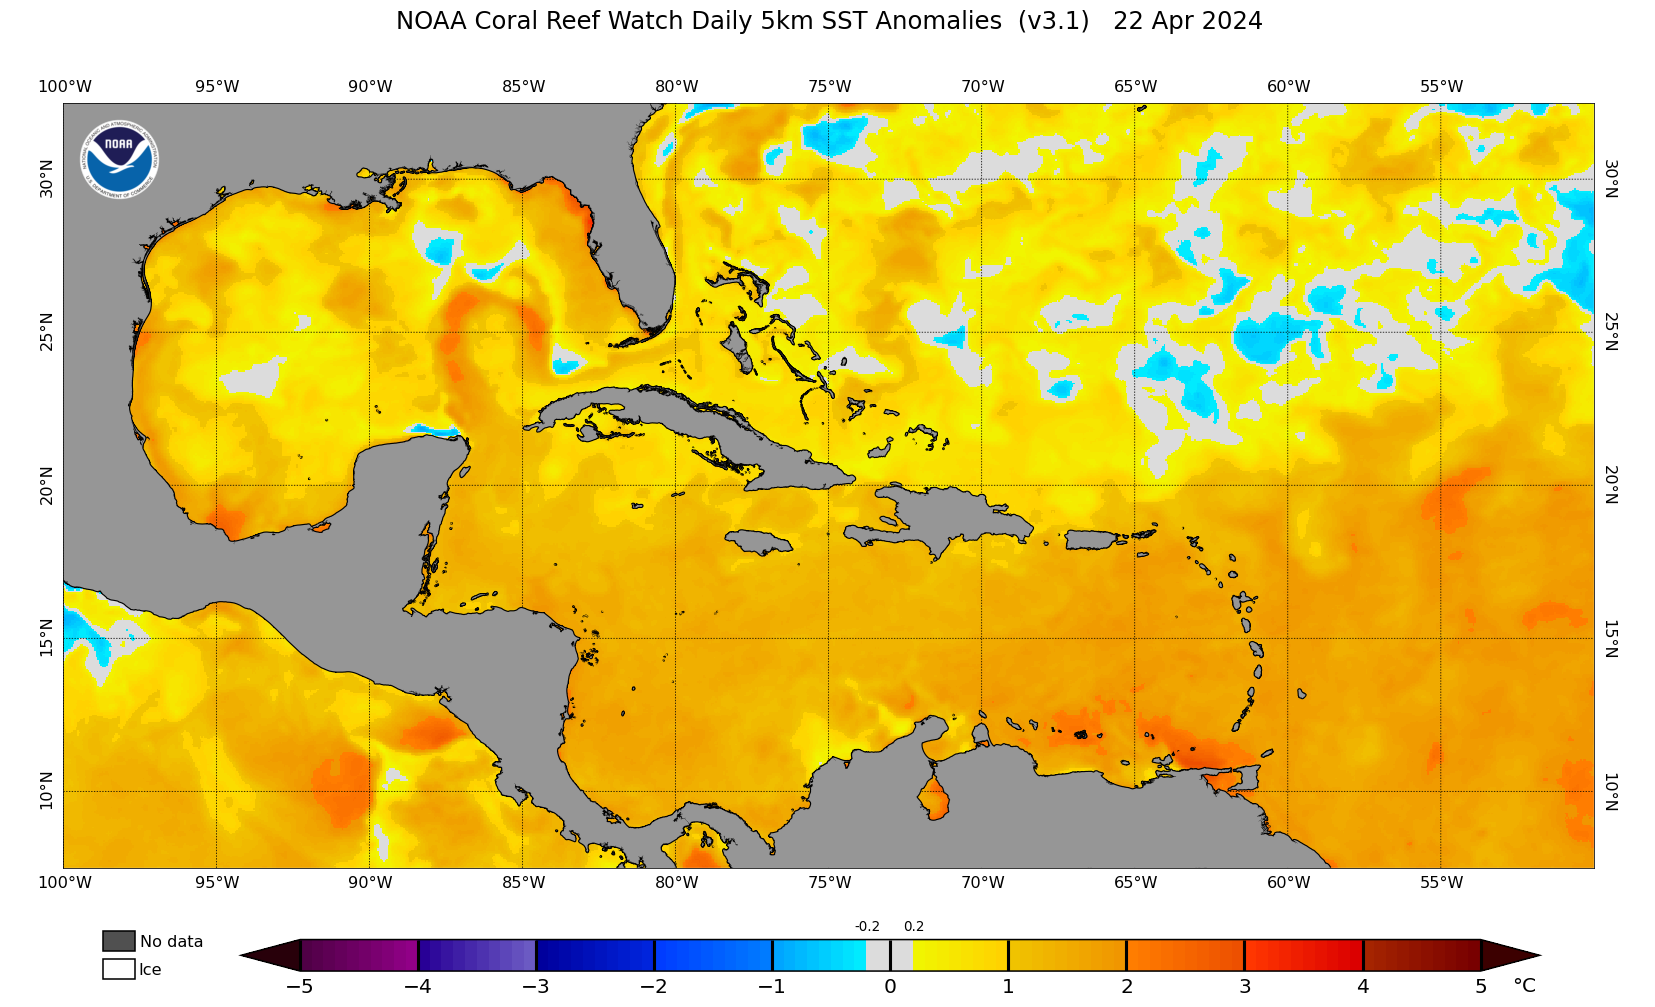
Credits: coralreefwatch.noaa.gov
SST Trend - Caribbean
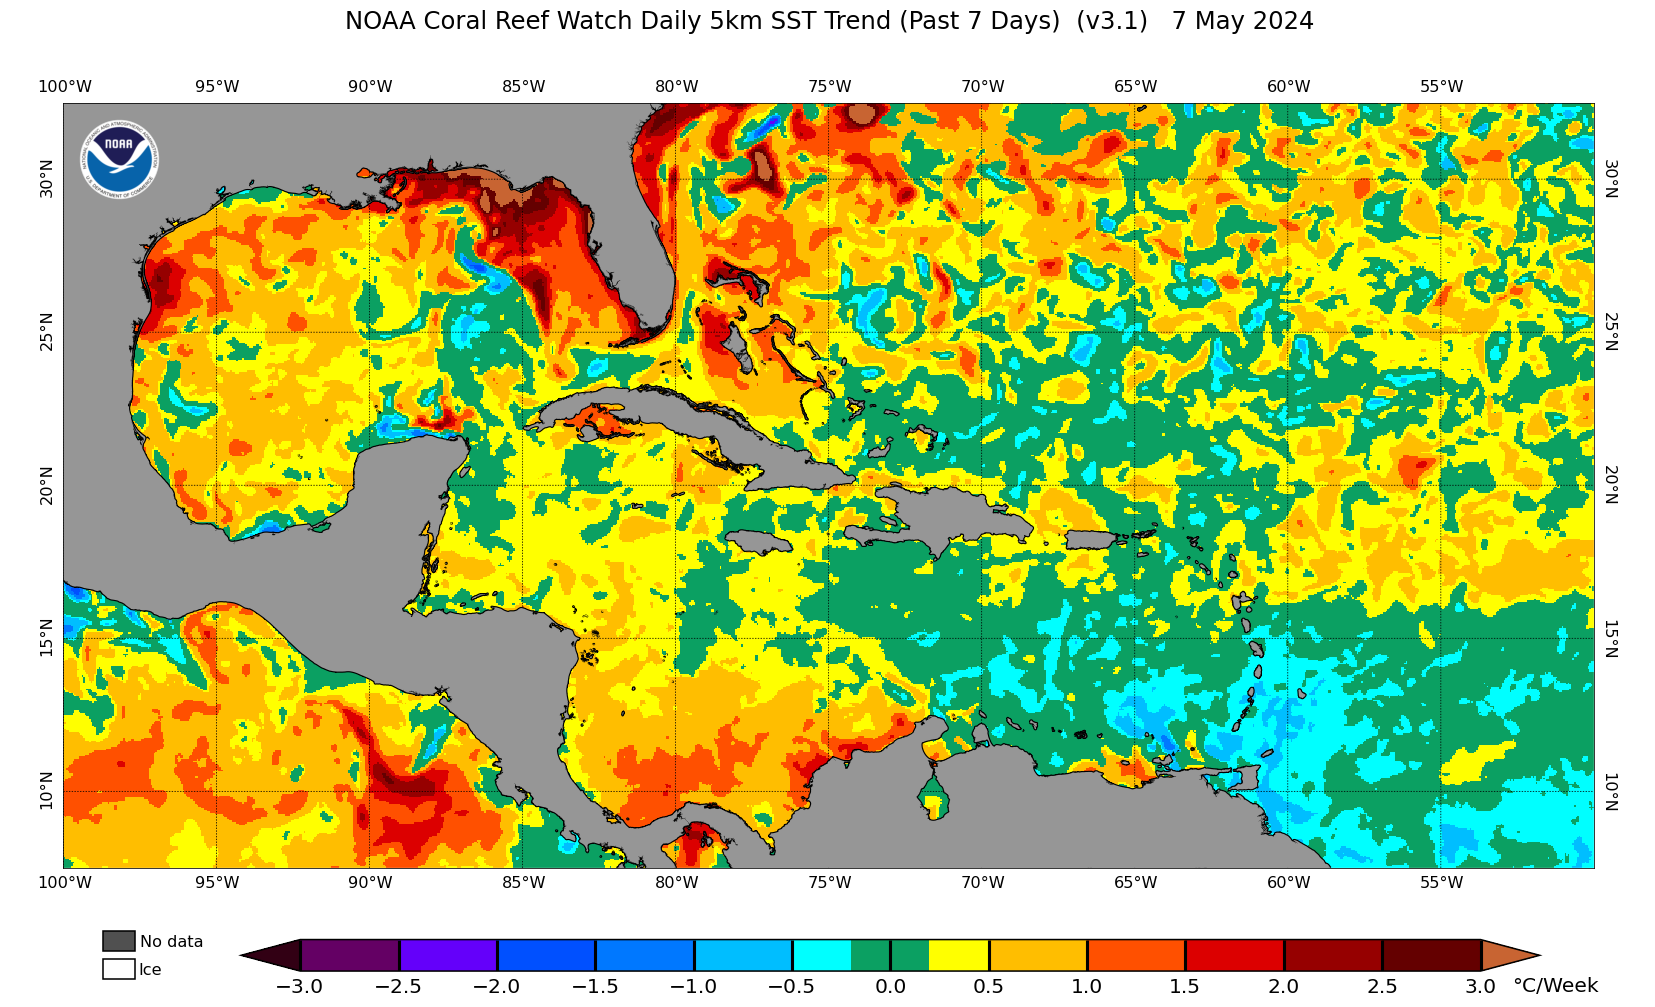
Credits: coralreefwatch.noaa.gov
SST - Florida
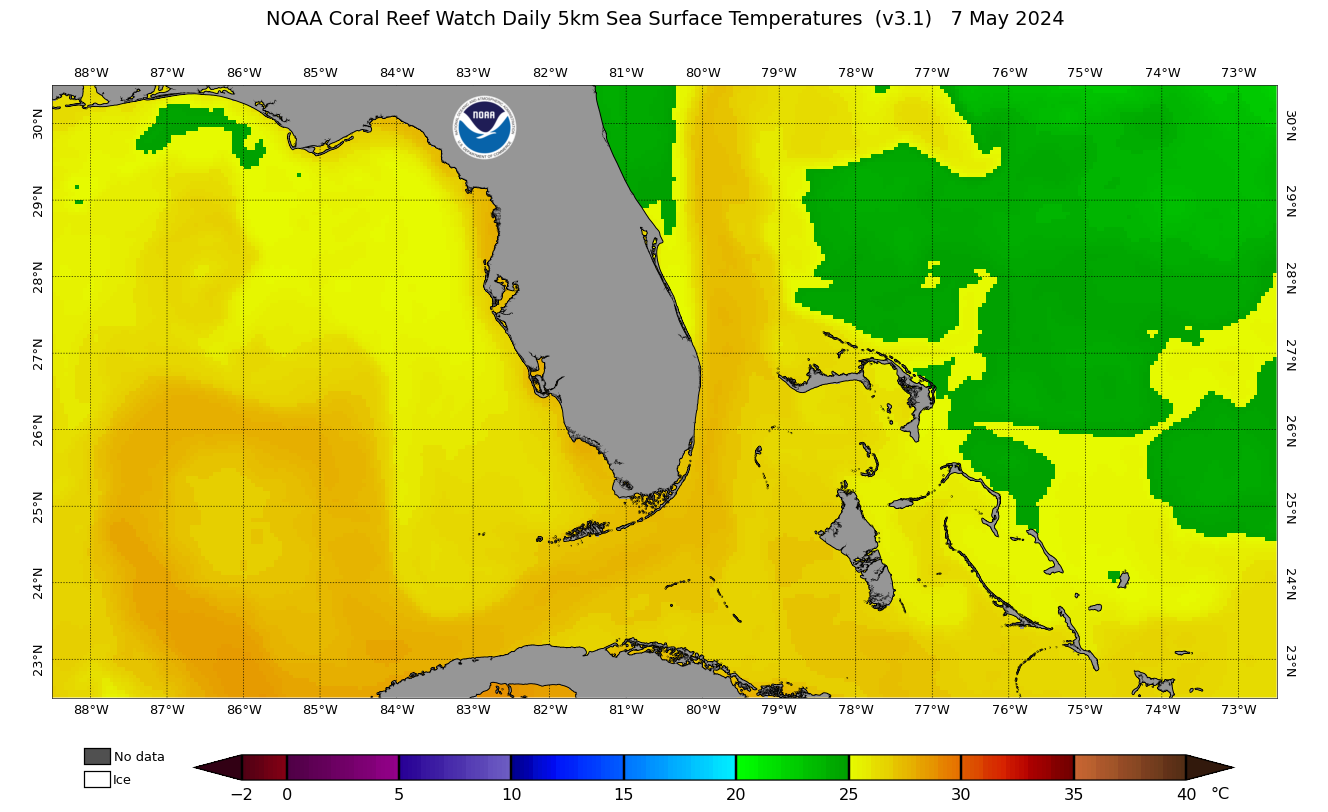
Credits: coralreefwatch.noaa.gov
SSTA - Florida
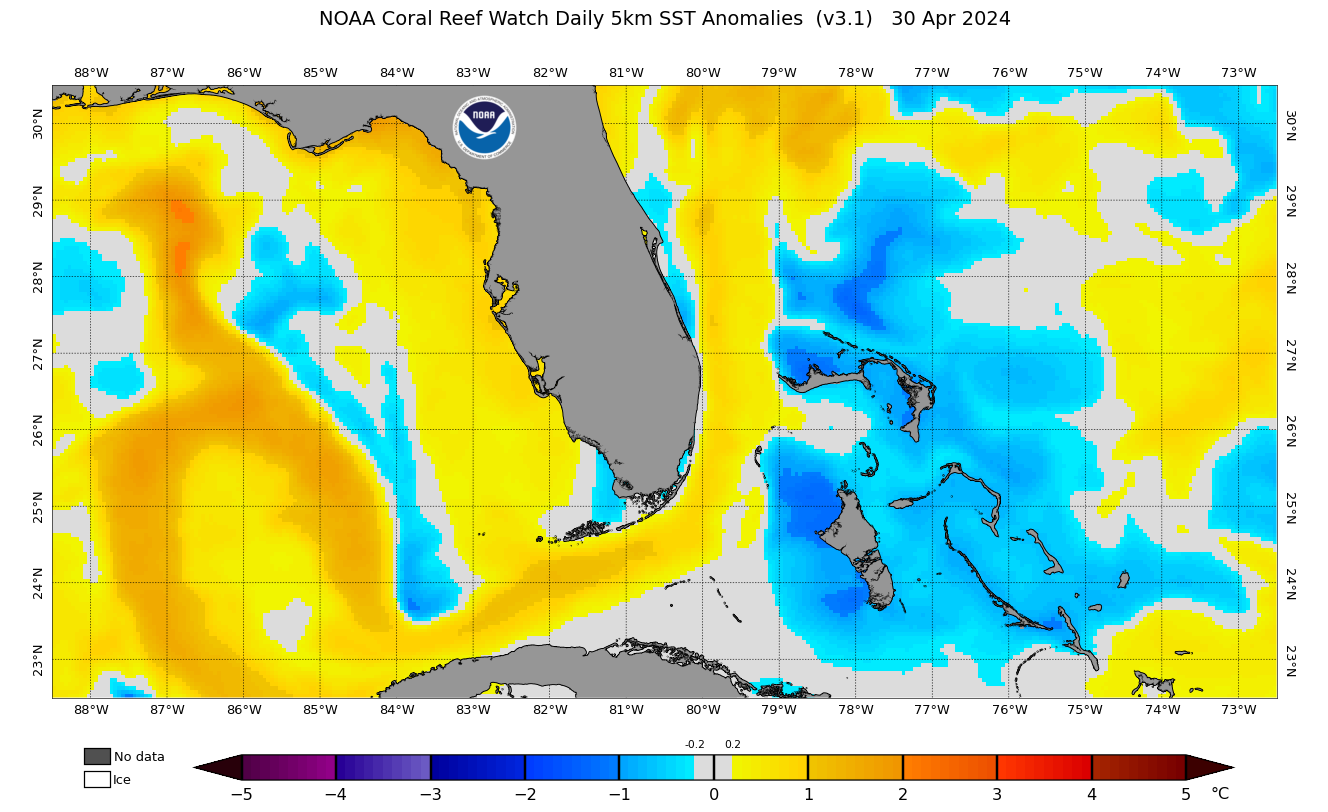
Credits: coralreefwatch.noaa.gov
SST Trend - Florida
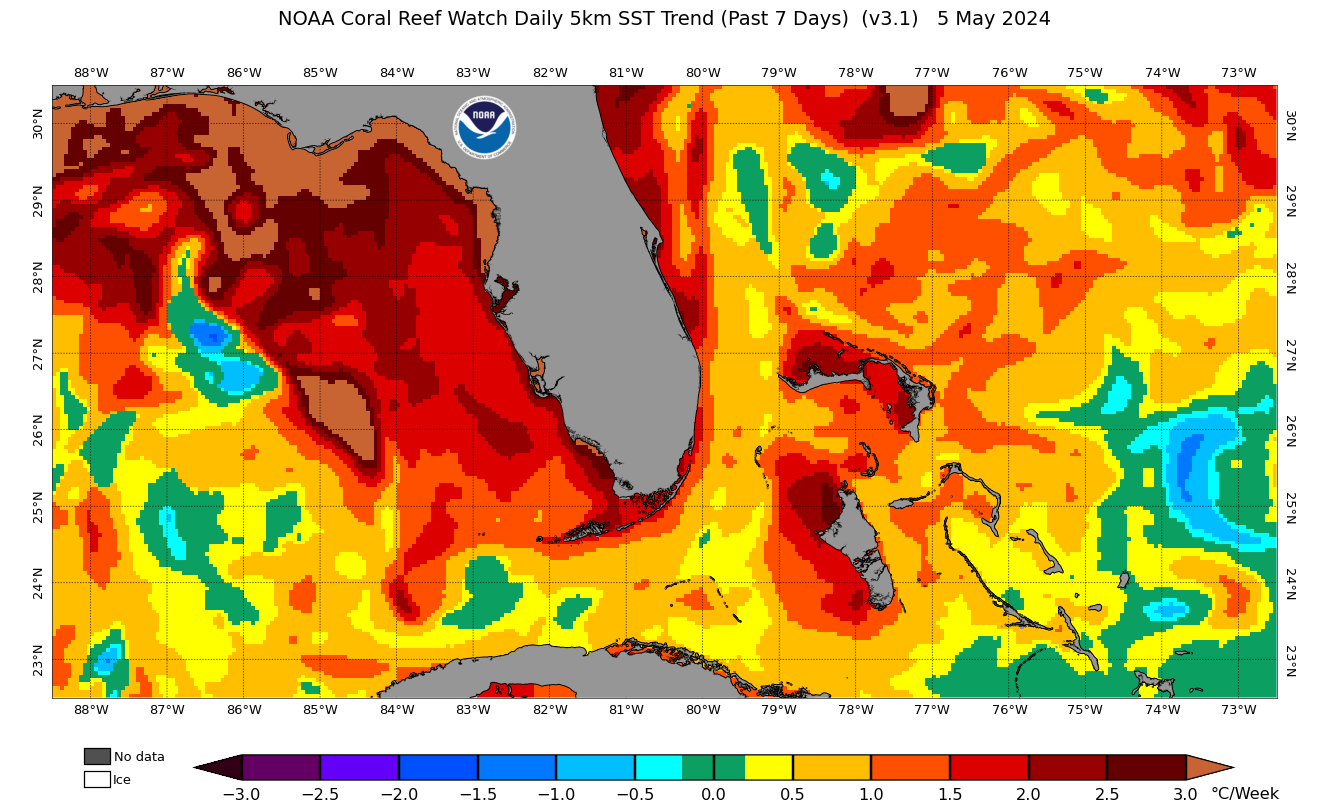
Credits: coralreefwatch.noaa.gov
SST - Hawaii
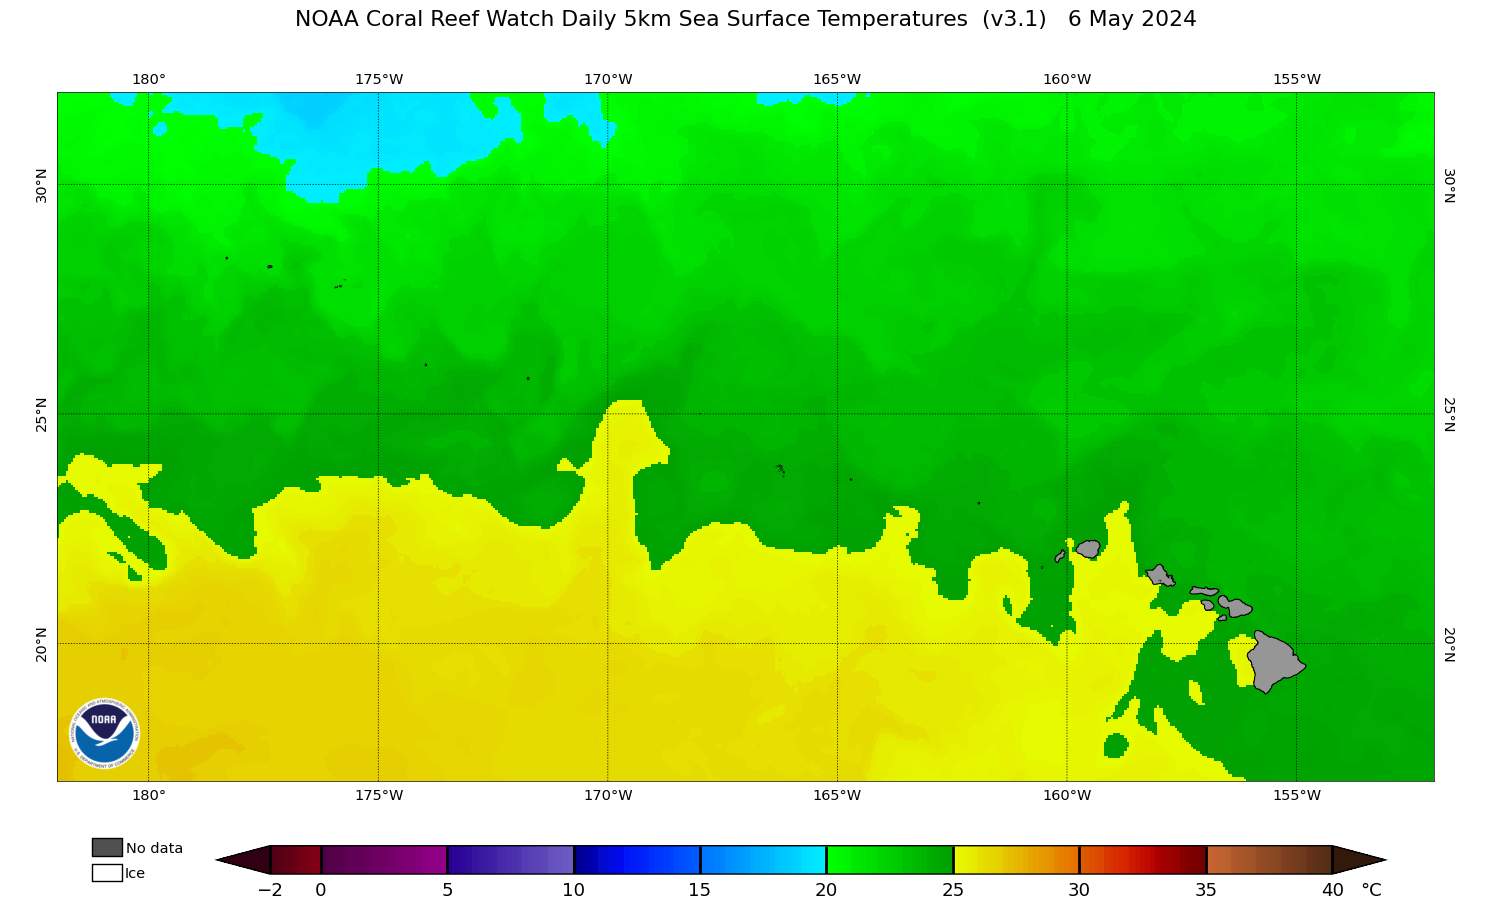
Credits: coralreefwatch.noaa.gov
SSTA - Hawaii
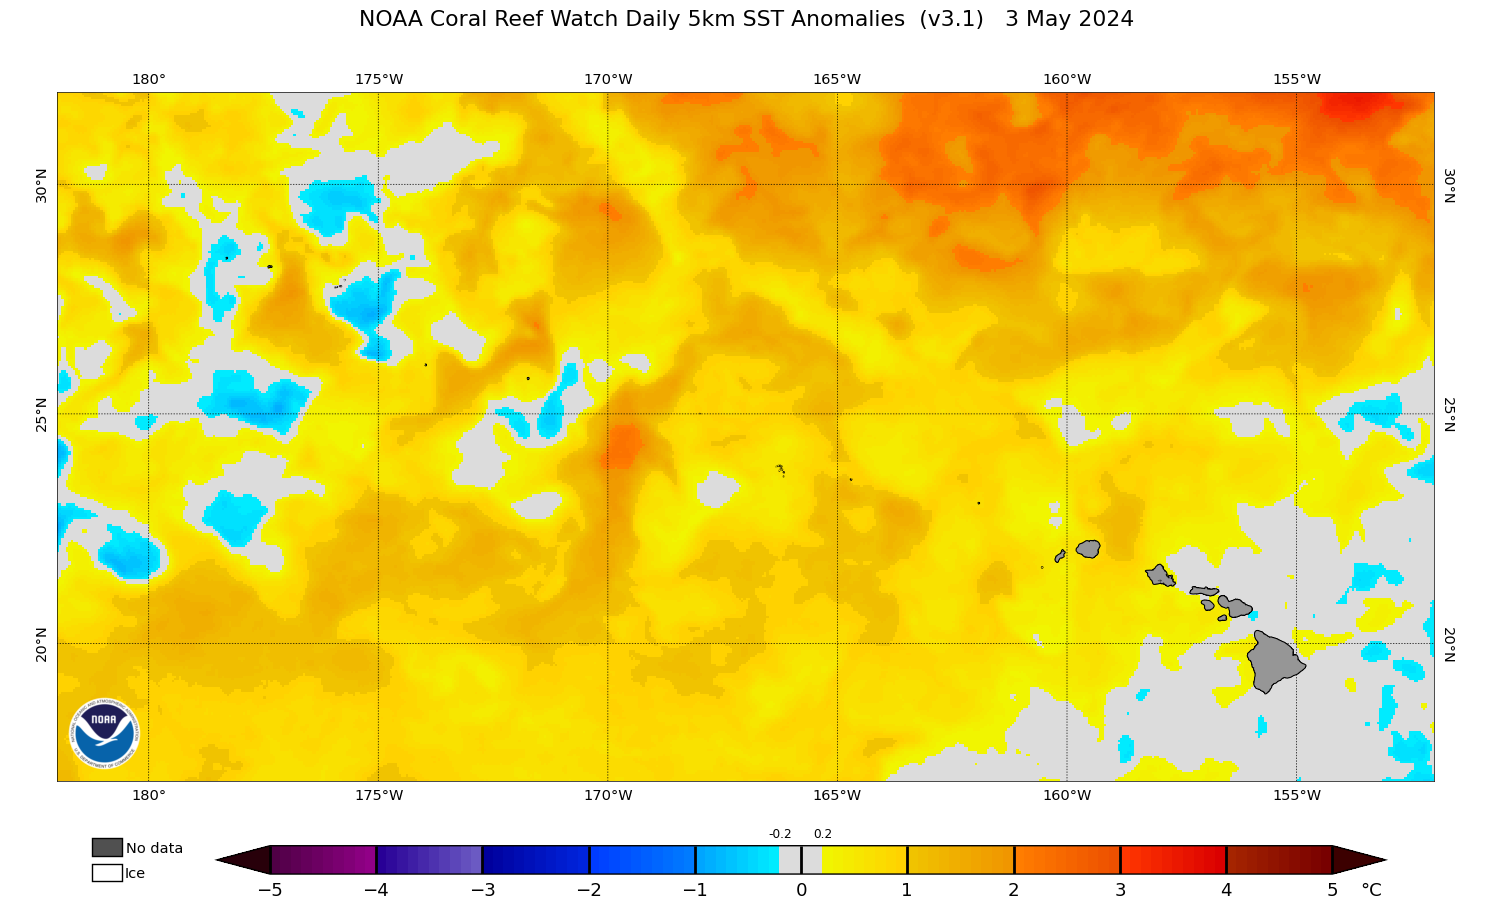
Credits: coralreefwatch.noaa.gov
SST Trend - Hawaii
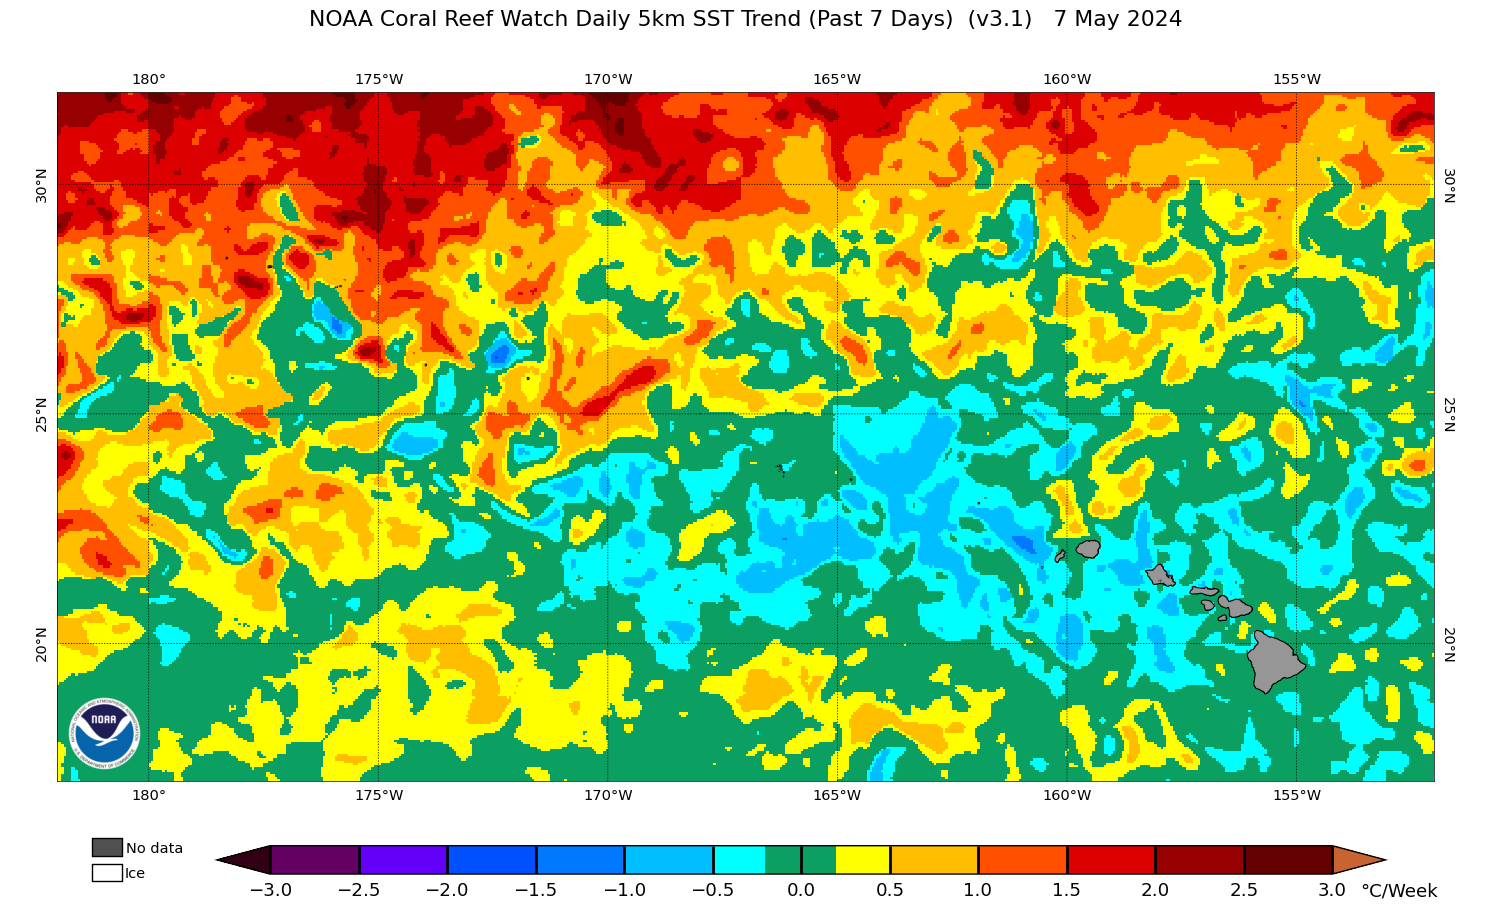
Credits: coralreefwatch.noaa.gov
SST - Great Barrier Reef)
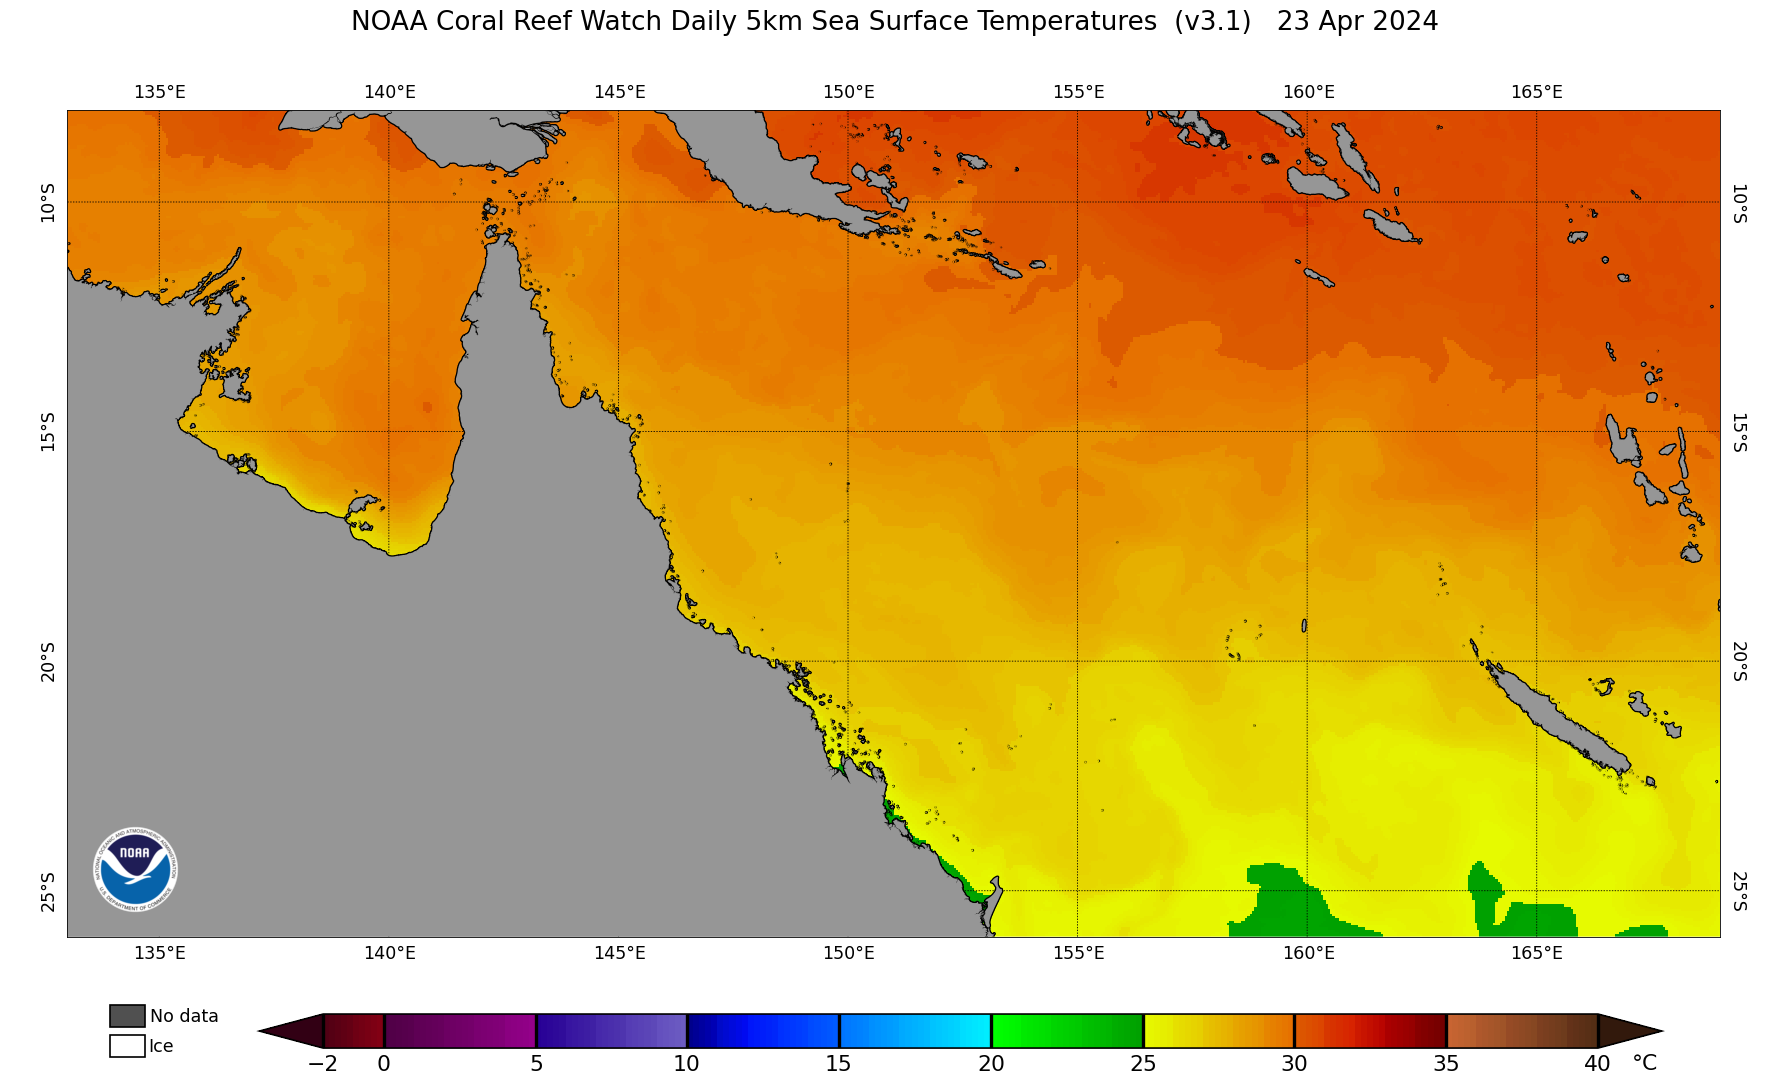
Credits: coralreefwatch.noaa.gov
SSTA - Great Barrier Reef)

Credits: coralreefwatch.noaa.gov
SST Trend - Great Barrier Reef)
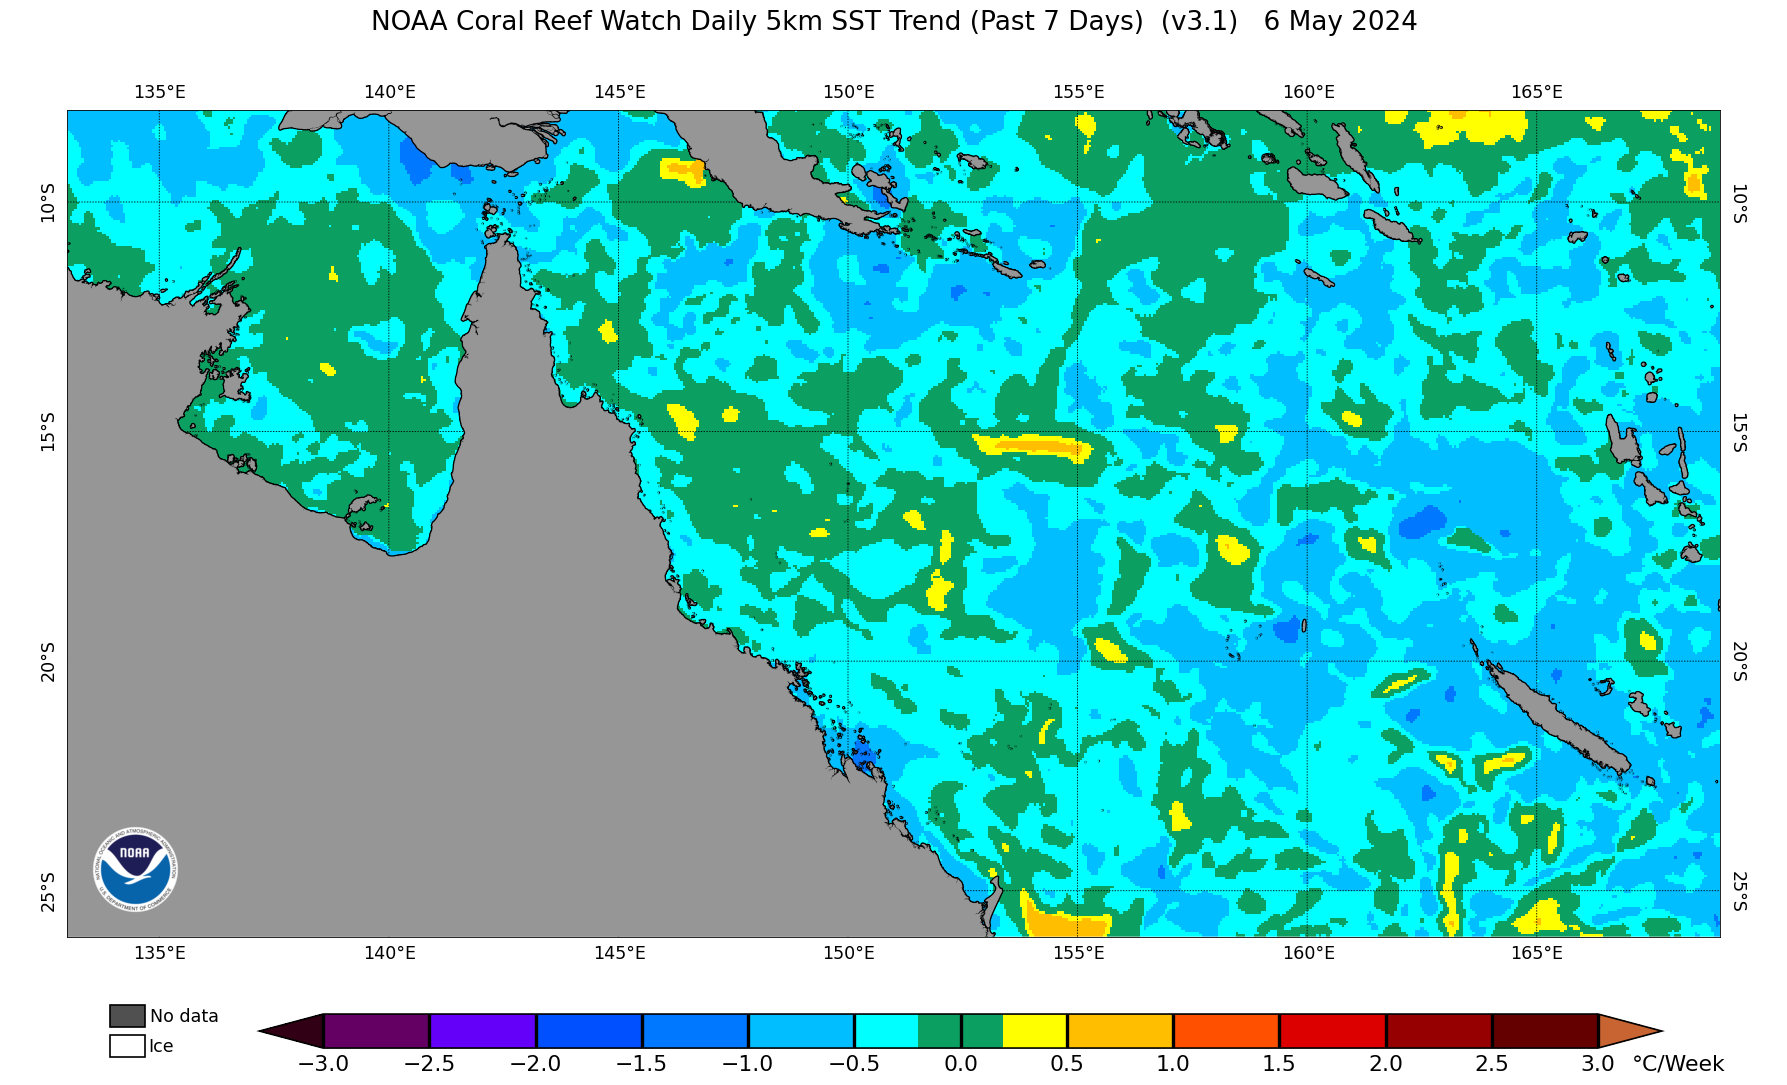
Credits: coralreefwatch.noaa.gov