North Atlantic Oscillation Index [NAO index]
Teleconnective indices: North Atlantic Oscillation Index [NAO index]
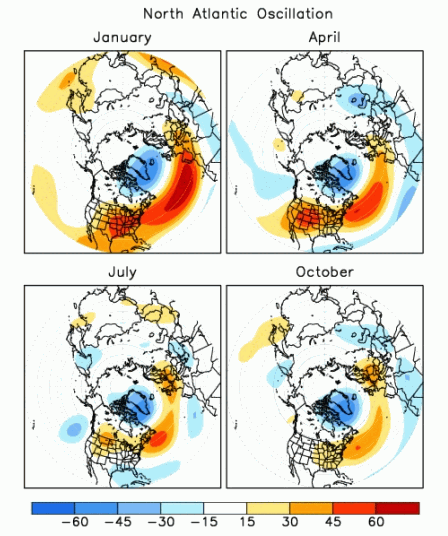
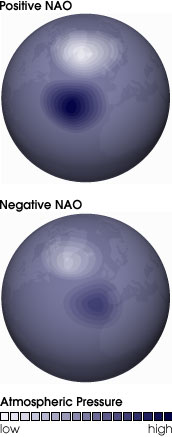
The North Atlantic Oscillation [NAO] is an atmospheric circulation pattern located
in the North Atlantic Ocean and characterized by the cyclic fluctuation of the difference of atmospheric pressure
at sea level between Iceland and the Azores.
The NAO index is calculated as the difference between the mean sea level pressure anomalies
on the Azores and the anomalies observed in Iceland.
When the Iceland cyclone is very intense (ie the pressure is very low) and the Azores anticyclone
is strengthened, there is a positive NAO phase (NAO+). In this situation, the Atlantic
perturbations follow unusually high trajectories and then slide down to the east of Italy.
A NAO+ is associated with cool summers and mild, rainy winters in north-central Europe,
low rainfall in the Mediterranean areas, above average temperatures in the eastern United States and
northern Europe, below average in Greenland and often in southern Europe and Middle Orient.
The reduction in westerly winds observed during a negative NAO (NAO-) phase leads to
opposite situations, with colder and more disturbed winters in the Mediterranean area.
The NAO index exhibits both considerable inter-seasonal and inter-annual variability
and prolonged periods (many months) of continuous phases of NAO+ or NAO-. The winter NAO shows
significant multi-decadal variability. For example, the negative phase of NAO dominated circulation
between the mid-1950s, until the winter of 1978-79. During this interval of about 24 years there
were 4 main periods of at least 3 years in which the negative phase was dominant and the positive
phase substantially absent.
Credits: cpc.ncep.noaa.gov
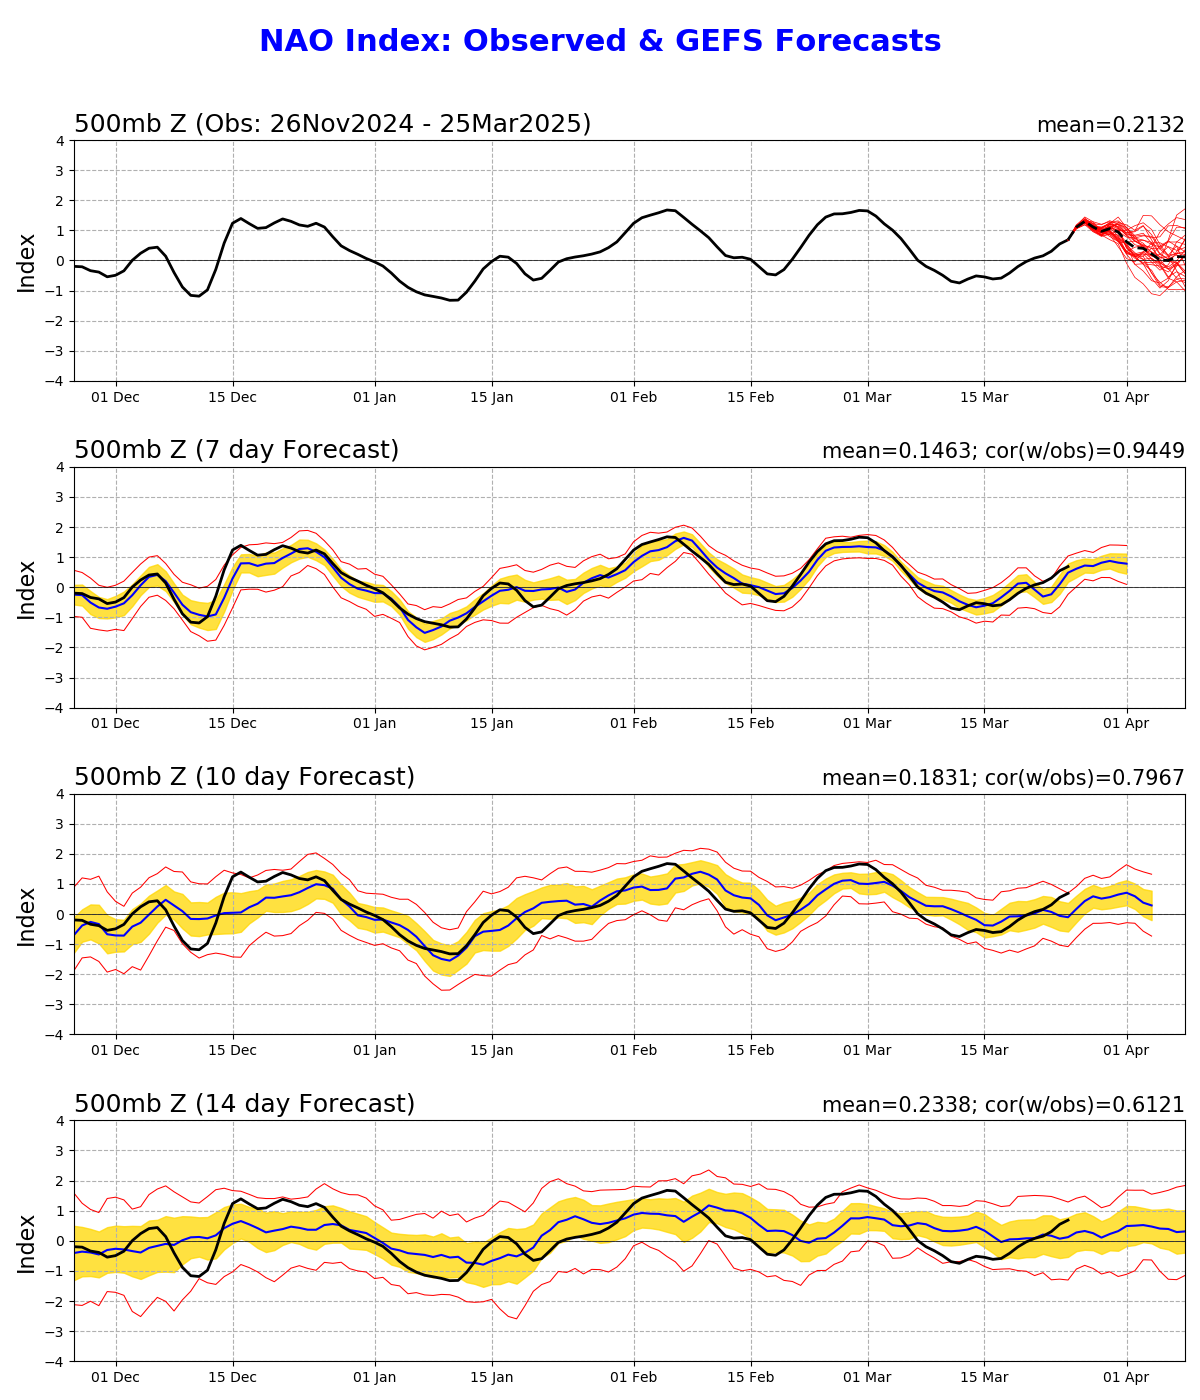
North Atlantic Oscillation - NAO index: observed & GFS forecasts
The daily NAO indices are shown for the previous 120 days, and the GFS forecasts
of the daily NAO index at selected lead times are appended onto the time series. The indices are
standardized by standard deviation of the observed monthly NAO index from 1950-2000 interpolated
to the day in question. A 3-day running mean is applied to the forecast time series.
The values at the upper left and right corner of each figure indicate the mean value of
the NAO index and the correlation coefficients between the observation and the forecasts, respectively.
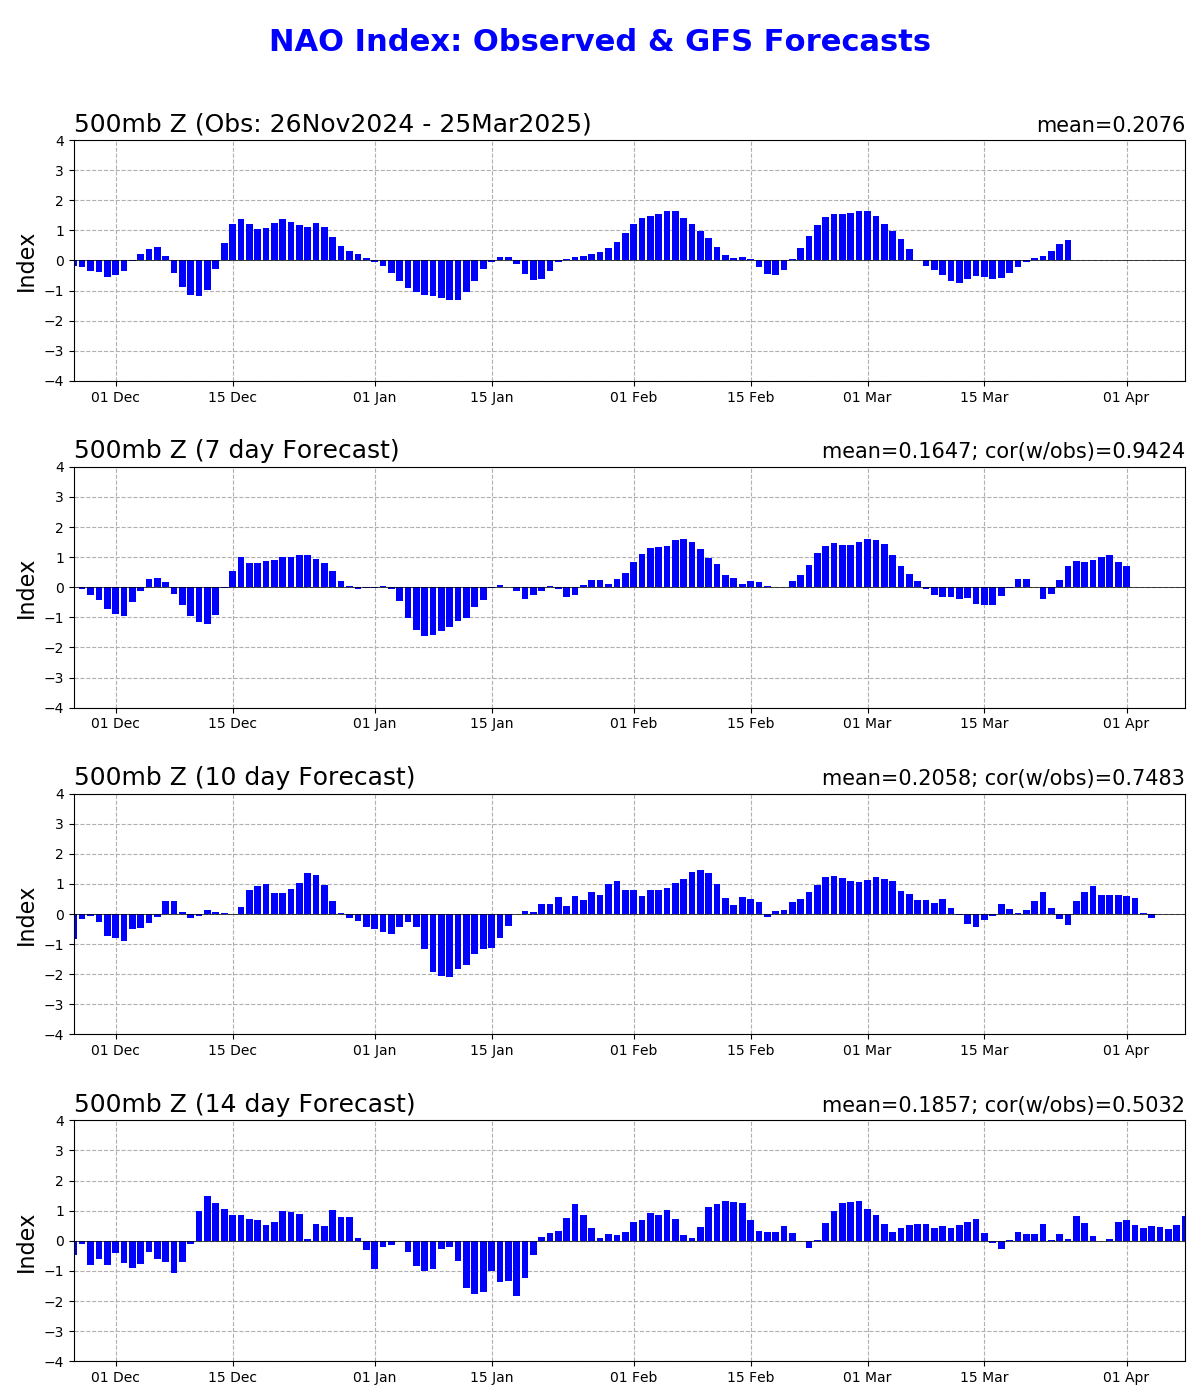
Credits: cpc.ncep.noaa.gov
North Atlantic Oscillation - NAO index: observed & GFS forecasts
The daily NAO indices are shown for the previous 120 days, and the GFS forecasts
of the daily NAO index at selected lead times are appended onto the time series. The indices are
standardized by standard deviation of the observed monthly NAO index from 1950-2000 interpolated
to the day in question. A 3-day running mean is applied to the forecast time series.
The values at the upper left and right corner of each figure indicate the mean value of
the NAO index and the correlation coefficients between the observation and the forecasts, respectively.
Credits: cpc.ncep.noaa.gov
Daily NAO index since January 1950
In the following table all the monthly average values of NAO index from 1950 to today.
With a red scale, values higher than +0.5 are highlighted, with a blue scale those lower than -0.5.
Below the table, a diagram again shows the NAO values recorded.
| JAN | FEB | MAR | APR | MAY | JUN | JUL | AUG | SEP | OCT | NOV | DEC | |
|---|---|---|---|---|---|---|---|---|---|---|---|---|
| 1950 | +0.920 | +0.400 | -0.360 | +0.730 | -0.590 | -0.060 | -1.260 | -0.050 | +0.250 | +0.850 | -1.260 | -1.020 |
| 1951 | +0.080 | +0.700 | -1.020 | -0.220 | -0.590 | -1.640 | +1.370 | -0.220 | -1.360 | +1.870 | -0.390 | +1.320 |
| 1952 | +0.930 | -0.830 | -1.490 | +1.010 | -1.120 | -0.400 | -0.090 | -0.280 | -0.540 | -0.730 | -1.130 | -0.430 |
| 1953 | +0.330 | -0.490 | -0.040 | -1.670 | -0.660 | +1.090 | +0.400 | -0.710 | -0.350 | +1.320 | +1.040 | -0.470 |
| 1954 | +0.370 | +0.740 | -0.830 | +1.340 | -0.090 | -0.250 | -0.600 | -1.900 | -0.440 | +0.600 | +0.400 | +0.690 |
| 1955 | -1.840 | -1.120 | -0.530 | -0.420 | -0.340 | -1.100 | +1.760 | +1.070 | +0.320 | -1.470 | -1.290 | +0.170 |
| 1956 | -0.220 | -1.120 | -0.050 | -1.060 | +2.210 | +0.100 | -0.750 | -1.370 | +0.240 | +0.880 | +0.510 | +0.100 |
| 1957 | +1.050 | +0.110 | -1.260 | +0.490 | -0.790 | -0.720 | -1.190 | -0.550 | -1.660 | +1.320 | +0.730 | +0.120 |
| 1958 | -0.540 | -1.060 | -1.960 | +0.370 | -0.240 | -1.380 | -1.730 | -1.560 | -0.070 | +0.160 | +1.640 | -0.700 |
| 1959 | -0.870 | +0.680 | -0.150 | +0.360 | +0.390 | +0.400 | +0.740 | +0.060 | +0.880 | +0.890 | +0.410 | +0.440 |
| 1960 | -1.290 | -1.890 | -0.500 | +1.360 | +0.450 | -0.210 | +0.350 | -1.400 | +0.390 | -1.730 | -0.510 | +0.060 |
| 1961 | +0.410 | +0.450 | +0.550 | -1.550 | -0.360 | +0.860 | -0.390 | +0.900 | +1.240 | +0.510 | -0.620 | -1.480 |
| 1962 | +0.610 | +0.550 | -2.470 | +0.990 | -0.100 | +0.160 | -2.470 | +0.140 | -0.370 | +0.410 | -0.230 | -1.320 |
| 1963 | -2.120 | -0.960 | -0.430 | -1.350 | +2.160 | -0.430 | -0.770 | -0.640 | +1.790 | +0.940 | -1.270 | -1.920 |
| 1964 | -0.950 | -1.430 | -1.200 | +0.360 | +0.520 | +1.290 | +1.900 | -1.770 | +0.200 | +0.740 | -0.010 | -0.150 |
| 1965 | -0.120 | -1.550 | -1.510 | +0.720 | -0.620 | +0.290 | +0.320 | +0.450 | +0.370 | +0.380 | -1.660 | +1.370 |
| 1966 | -1.740 | -1.390 | +0.560 | -0.750 | +0.220 | +1.050 | +0.320 | -1.760 | -0.450 | -0.680 | -0.040 | +0.720 |
| 1967 | -0.890 | +0.190 | +1.510 | +0.180 | -0.990 | +1.400 | +0.410 | +1.440 | +0.930 | +0.070 | +0.600 | -0.450 |
| 1968 | +0.130 | -1.290 | +0.400 | -1.080 | -1.760 | +0.330 | -0.800 | -0.660 | -1.920 | -2.300 | -0.930 | -1.400 |
| 1969 | -0.830 | -1.550 | -1.560 | +1.530 | +0.550 | +0.550 | +0.570 | -1.450 | +2.070 | +0.660 | -0.960 | -0.280 |
| 1970 | -1.500 | +0.640 | -0.960 | -1.300 | +1.140 | +1.550 | +0.100 | +0.100 | -0.090 | -0.920 | -0.600 | -1.200 |
| 1971 | -1.130 | +0.240 | -0.840 | -0.240 | +0.500 | -1.570 | +0.240 | +1.550 | +0.390 | +0.580 | -0.200 | +0.600 |
| 1972 | +0.270 | +0.320 | +0.720 | -0.220 | +0.950 | +0.880 | +0.180 | +1.320 | -0.120 | +1.090 | +0.540 | +0.190 |
| 1973 | +0.040 | +0.850 | +0.300 | -0.540 | -0.440 | +0.390 | +0.570 | -0.060 | -0.300 | -1.240 | -0.930 | +0.320 |
| 1974 | +1.340 | -0.140 | -0.030 | +0.510 | -0.240 | -0.140 | -0.760 | -0.640 | +0.820 | +0.490 | -0.540 | +1.500 |
| 1975 | +0.580 | -0.620 | -0.610 | -1.600 | -0.520 | -0.840 | +1.550 | -0.260 | +1.560 | -0.540 | +0.410 | +0.000 |
| 1976 | -0.250 | +0.930 | +0.750 | +0.260 | +0.960 | +0.800 | -0.320 | +1.920 | -1.290 | -0.080 | +0.170 | -1.600 |
| 1977 | -1.040 | -0.490 | -0.810 | +0.650 | -0.860 | -0.570 | -0.450 | -0.280 | +0.370 | +0.520 | -0.070 | -1.000 |
| 1978 | +0.660 | -2.200 | +0.700 | -1.170 | +1.080 | +1.380 | -1.140 | +0.640 | +0.460 | +1.930 | +3.040 | -1.570 |
| 1979 | -1.380 | -0.670 | +0.780 | -1.710 | -1.030 | +1.600 | +0.830 | +0.960 | +1.010 | -0.300 | +0.530 | +1.000 |
| 1980 | -0.750 | +0.050 | -0.310 | +1.290 | -1.500 | -0.370 | -0.420 | -2.240 | +0.660 | -1.770 | -0.370 | +0.780 |
| 1981 | +0.370 | +0.920 | -1.190 | +0.360 | +0.200 | -0.450 | +0.050 | +0.390 | -1.450 | -1.350 | -0.380 | -0.020 |
| 1982 | -0.890 | +1.150 | +1.150 | +0.100 | -0.530 | -1.630 | +1.150 | +0.260 | +1.760 | -0.740 | +1.600 | +1.780 |
| 1983 | +1.590 | -0.530 | +0.950 | -0.850 | -0.070 | +0.990 | +1.190 | +1.610 | -1.120 | +0.650 | -0.980 | +0.290 |
| 1984 | +1.660 | +0.720 | -0.370 | -0.280 | +0.540 | -0.420 | -0.070 | +1.150 | +0.170 | -0.070 | -0.060 | +0.000 |
| 1985 | -1.610 | -0.490 | +0.200 | +0.320 | -0.490 | -0.800 | +1.220 | -0.480 | -0.520 | +0.900 | -0.670 | +0.220 |
| 1986 | +1.110 | -1.000 | +1.710 | -0.590 | +0.850 | +1.220 | +0.120 | -1.090 | -1.120 | +1.550 | +2.290 | +0.990 |
| 1987 | -1.150 | -0.730 | +0.140 | +2.000 | +0.980 | -1.820 | +0.520 | -0.830 | -1.220 | +0.140 | +0.180 | +0.320 |
| 1988 | +1.020 | +0.760 | -0.170 | -1.170 | +0.630 | +0.880 | -0.350 | +0.040 | -0.990 | -1.080 | -0.340 | +0.610 |
| 1989 | +1.170 | +2.000 | +1.850 | +0.280 | +1.380 | -0.270 | +0.970 | +0.010 | +2.050 | -0.030 | +0.160 | -1.150 |
| 1990 | +1.040 | +1.410 | +1.460 | +2.000 | -1.530 | -0.020 | +0.530 | +0.970 | +1.060 | +0.230 | -0.240 | +0.220 |
| 1991 | +0.860 | +1.040 | -0.200 | +0.290 | +0.080 | -0.820 | -0.490 | +1.230 | +0.480 | -0.190 | +0.480 | +0.460 |
| 1992 | -0.130 | +1.070 | +0.870 | +1.860 | +2.630 | +0.200 | +0.160 | +0.850 | -0.440 | -1.760 | +1.190 | +0.470 |
| 1993 | +1.600 | +0.500 | +0.670 | +0.970 | -0.780 | -0.590 | -3.180 | +0.120 | -0.570 | -0.710 | +2.560 | +1.560 |
| 1994 | +1.040 | +0.460 | +1.260 | +1.140 | -0.570 | +1.520 | +1.310 | +0.380 | -1.320 | -0.970 | +0.640 | +2.020 |
| 1995 | +0.930 | +1.140 | +1.250 | -0.850 | -1.490 | +0.130 | -0.220 | +0.690 | +0.310 | +0.190 | -1.380 | -1.670 |
| 1996 | -0.120 | -0.070 | -0.240 | -0.170 | -1.060 | +0.560 | +0.670 | +1.020 | -0.860 | -0.330 | -0.560 | -1.410 |
| 1997 | -0.490 | +1.700 | +1.460 | -1.020 | -0.280 | -1.470 | +0.340 | +0.830 | +0.610 | -1.700 | -0.900 | -0.960 |
| 1998 | +0.390 | -0.110 | +0.870 | -0.680 | -1.320 | -2.720 | -0.480 | -0.020 | -2.000 | -0.290 | -0.280 | +0.870 |
| 1999 | +0.770 | +0.290 | +0.230 | -0.950 | +0.920 | +1.120 | -0.900 | +0.390 | +0.360 | +0.200 | +0.650 | +1.610 |
| 2000 | +0.600 | +1.700 | +0.770 | -0.030 | +1.580 | -0.030 | -1.030 | -0.290 | -0.210 | +0.920 | -0.920 | -0.580 |
| 2001 | +0.250 | +0.450 | -1.260 | +0.000 | -0.020 | -0.200 | -0.250 | -0.070 | -0.650 | -0.240 | +0.630 | -0.830 |
| 2002 | +0.440 | +1.100 | +0.690 | +1.180 | -0.220 | +0.380 | +0.620 | +0.380 | -0.700 | -2.280 | -0.180 | -0.940 |
| 2003 | +0.160 | +0.620 | +0.320 | -0.180 | +0.010 | -0.070 | +0.130 | -0.070 | +0.010 | -1.260 | +0.860 | +0.640 |
| 2004 | -0.290 | -0.140 | +1.020 | +1.150 | +0.190 | -0.890 | +1.130 | -0.480 | +0.380 | -1.100 | +0.730 | +1.210 |
| 2005 | +1.520 | -0.060 | -1.830 | -0.300 | -1.250 | -0.050 | -0.510 | +0.370 | +0.630 | -0.980 | -0.310 | -0.440 |
| 2006 | +1.265 | -0.511 | -1.278 | +1.235 | -1.144 | +0.841 | +0.902 | -1.726 | -1.622 | -2.244 | +0.437 | +1.337 |
| 2007 | +0.223 | -0.470 | +1.442 | +0.169 | +0.664 | -1.306 | -0.579 | -0.139 | +0.721 | +0.447 | +0.576 | +0.344 |
| 2008 | +0.890 | +0.735 | +0.076 | -1.065 | -1.728 | -1.389 | -1.274 | -1.160 | +1.017 | -0.043 | -0.320 | -0.277 |
| 2009 | -0.007 | +0.057 | +0.572 | -0.204 | +1.683 | -1.207 | -2.153 | -0.194 | +1.509 | -1.032 | -0.025 | -1.926 |
| 2010 | -1.109 | -1.984 | -0.883 | -0.720 | -1.487 | -0.816 | -0.425 | -1.223 | -0.795 | -0.928 | -1.616 | -1.847 |
| 2011 | -0.877 | +0.701 | +0.613 | +2.478 | -0.062 | -1.280 | -1.512 | -1.347 | +0.536 | +0.394 | +1.360 | +2.521 |
| 2012 | +1.174 | +0.420 | +1.266 | +0.471 | -0.907 | -2.531 | -1.321 | -0.983 | -0.586 | -2.062 | -0.578 | +0.171 |
| 2013 | +0.345 | -0.453 | -1.612 | +0.687 | +0.569 | +0.521 | +0.672 | +0.970 | +0.241 | -1.280 | +0.901 | +0.946 |
| 2014 | +0.290 | +1.335 | +0.798 | +0.305 | -0.922 | -0.970 | +0.175 | -1.681 | +1.616 | -1.271 | +0.678 | +1.857 |
| 2015 | +1.789 | +1.323 | +1.450 | +0.725 | +0.145 | -0.067 | -3.179 | -0.760 | -0.648 | +0.437 | +1.744 | +2.244 |
| 2016 | +0.117 | +1.580 | +0.734 | +0.375 | -0.774 | -0.432 | -1.760 | -1.645 | +0.611 | +0.411 | -0.164 | +0.478 |
| 2017 | +0.478 | +1.005 | +0.737 | +1.732 | -1.911 | +0.045 | +1.256 | -1.098 | -0.613 | +0.186 | -0.005 | +0.882 |
| 2018 | +1.442 | +1.578 | -0.927 | +1.241 | +2.121 | +1.088 | +1.389 | +1.967 | +1.674 | +0.934 | -0.111 | +0.612 |
| 2019 | +0.592 | +0.291 | +1.232 | +0.466 | -2.623 | -1.089 | -1.425 | -1.168 | -0.164 | -1.413 | +0.279 | +1.202 |
| 2020 | +1.343 | +1.257 | +1.013 | -1.022 | -0.410 | -0.147 | -1.226 | +0.122 | +0.985 | -0.655 | +2.545 | -0.302 |
| 2021 | -1.109 | +0.136 | +0.730 | -1.425 | -1.239 | +0.765 | +0.026 | -0.282 | -0.214 | -2.290 | -0.185 | +0.288 |
| 2022 | +1.078 | +1.683 | +0.768 | -0.365 | +0.706 | -0.118 | -0.094 | +1.470 | -1.611 | -0.718 | +0.692 | -0.146 |
| 2023 | +1.250 | +0.923 | -1.109 | -0.628 | +0.386 | -0.578 | -2.175 | -1.164 | -0.441 | -2.029 | -0.319 | +1.937 |
| 2024 | +0.206 | +1.089 | -0.214 |
Standardized 3-Month Running Mean NAO Index
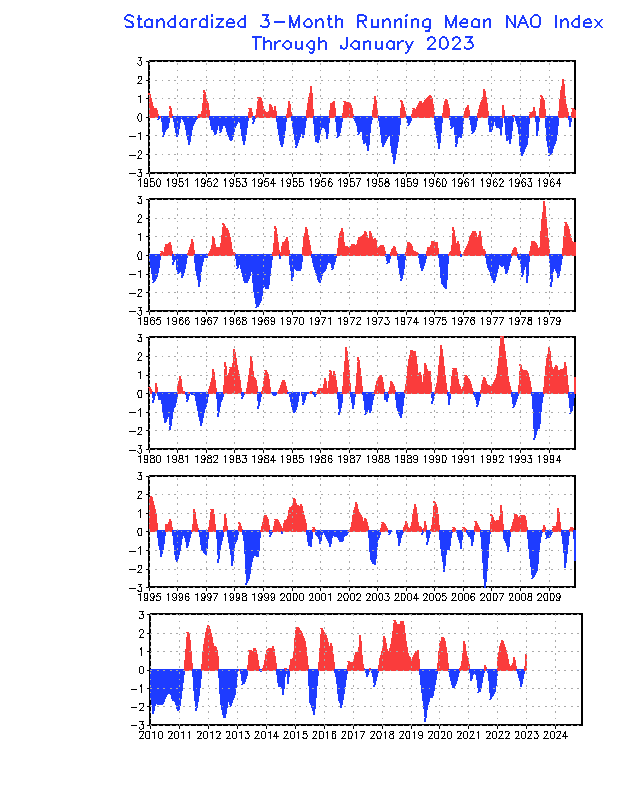
Credits: cpc.ncep.noaa.gov
Cold season NAO Index
The standardized seasonal mean NAO index during cold season (blue line) is constructed by averaging the monthly NAO index for January, February and March for each year. The black line denotes the standardized five-year running mean of the index. Both curves are standardized using 1950-2000 base period statistics.
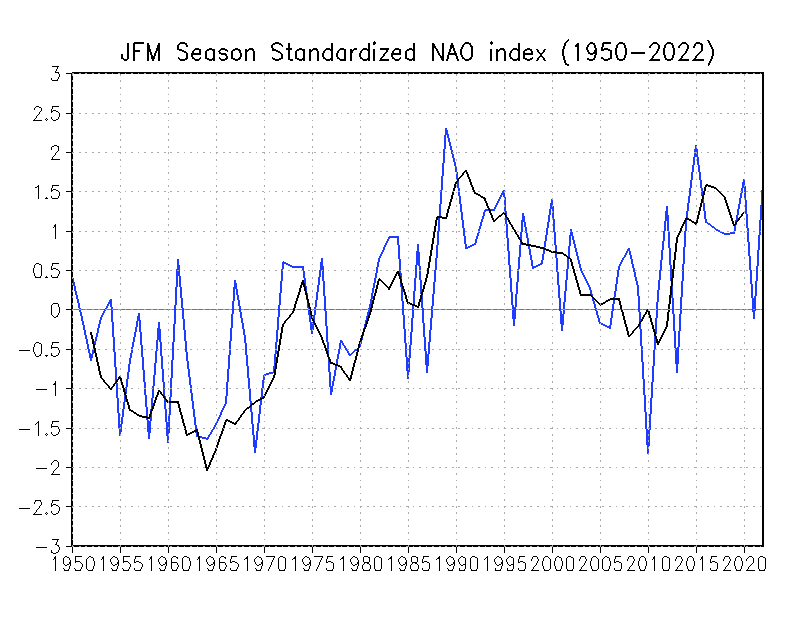
Credits: cpc.ncep.noaa.gov